Austin Area Real Estate Market Statistics
Updated April 2010
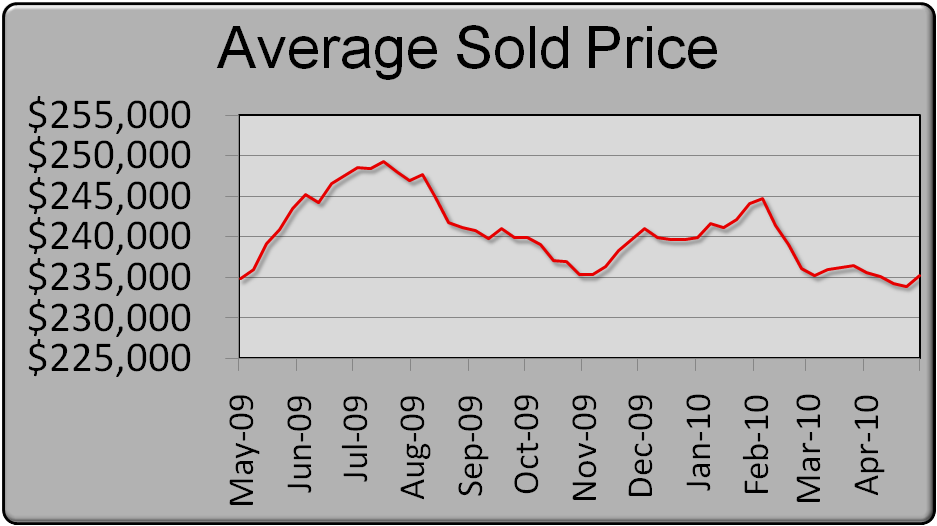
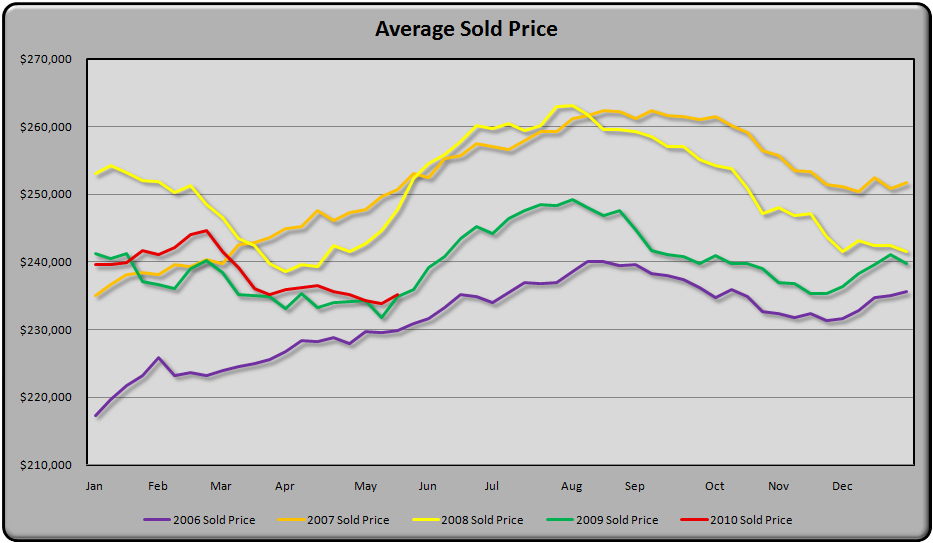
Average Weekly Sold price
Over the last year the average
sold price in Austin has remained relatively stable as you can
see by the graph to the right. The variance has ranged
from $230,000 to $250,000 with the low occurring at the end of
April 2009.
Historically, average prices tend to increase between May and
September with the market peak occurring in late July or early
September. The low point of the market tends to occur in
late January or early February. This year that low was
delayed until mid March due to the effects of the Federal Tax
Credit for home buyers.
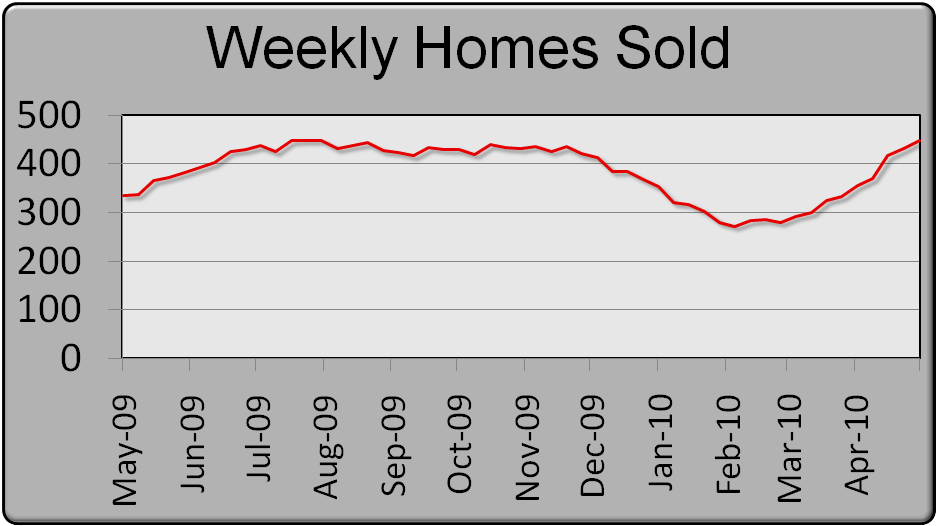
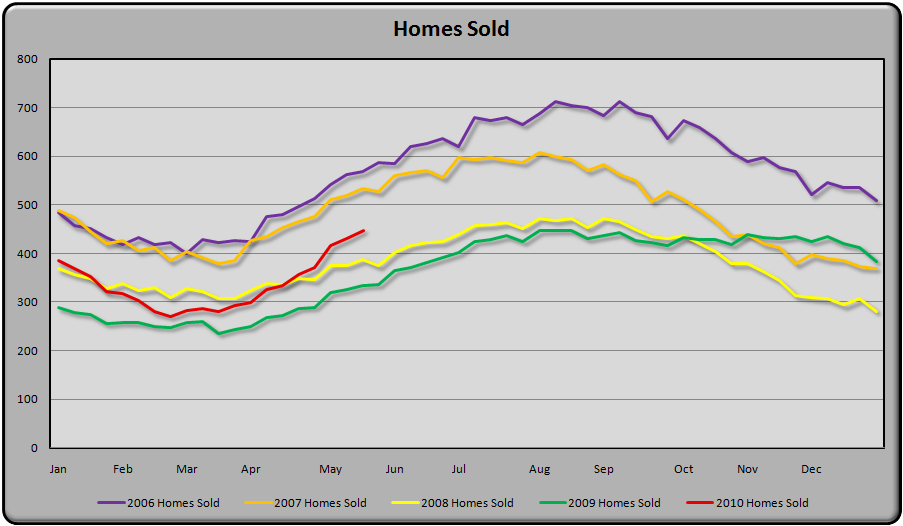
Weekly Homes Sold
Over the last year the average
weekly number of homes
sold has varied
from 300 to 450 with the low occurring at the end of
February 2010.
Historically, the number of homes sold tend to increase between May and
September with the market peak occurring in late July or early
September. The low point of the market tends to occur in
late January or early February. This year that low was
delayed due to the effects of the Federal Tax
Credit for home buyers.
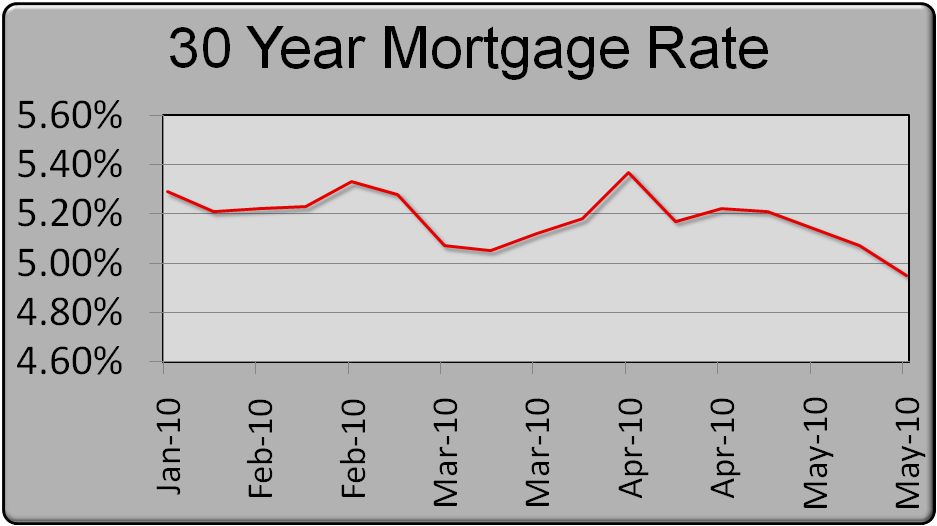
Average 30 Yr Rate
Over the last 90 days the average
30 year mortgage rate has been near historical lows. The
variance has ranged
from 4.75% to 5.38% with the low occurring in early March.
5 Year Price Trend
This graph shows the 5 year price
trend for homes in Austin. So for in 2010 we are trending
very close to 2009 prices. However, Austin still isn't too
far off of historical highs. As you can see from the
graph, prices tend to oscillate throughout the year with the
highs occurring in August and September and the lows occurring in
between January and March.
Data source: Austin MLS
5 Yr Weekly Sold Count
This graph shows the 5 year
weekly average of the number of homes sold in Austin. So for in 2010 we are trending
very close to 2008 volumes and are ahead of 2009 numbers. Austin
is about 20% below the peak volumes that were seen in 2006. As you can see from the
graph, volume tends to oscillate throughout the year with the
highs occurring in August and September and the lows occurring in
between February and March.
Data source: Austin MLS
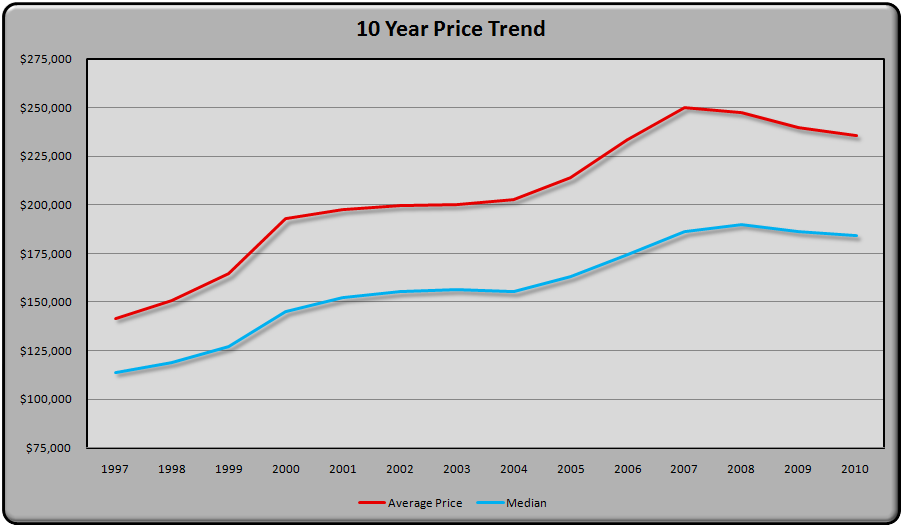
10 Yr Price Trend
This graph shows the 10 year
price trend for homes in Austin. So for in 2010 we are trending
very close to 2009 prices. However, Austin still isn't to far
off of historical highs. The rapid increases in 1999 and 2006
came at times of peak population increases in Austin and were
driven by a strong jobs economy.
You also may notice the gap between the median and average price
has expanded over the last 10 years.
Data source: Austin MLS
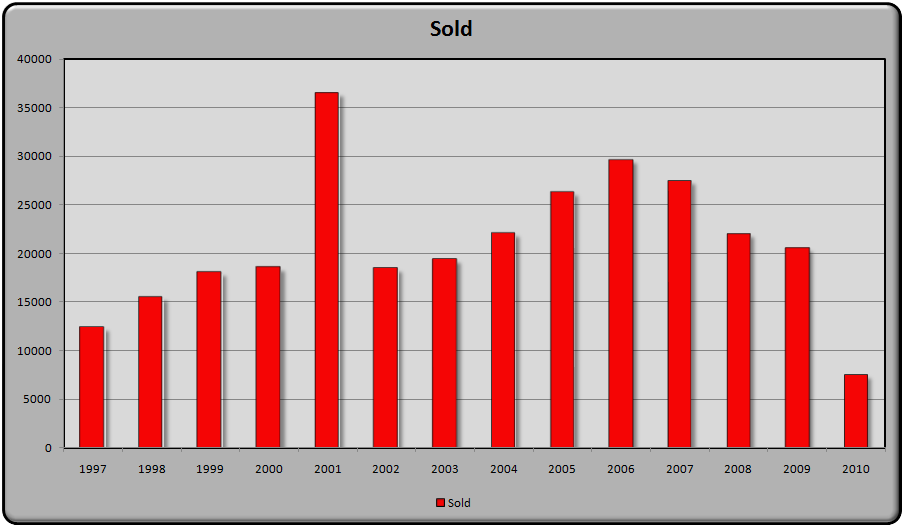
10 Yr Sold Trend
Over the past 10 years Austin has
shown some up and down in the number of homes sold, however, the
long term trend line is still heading up. An anomaly
occurred in 2001 when sales sky rocketed and nearly doubled the
previous year. While volume was strong, prices were flat
in 2001 mostly driven by attractive interest rates and an
abundance of new construction.
This year, look for sales numbers to end up near 2009 volume
numbers.
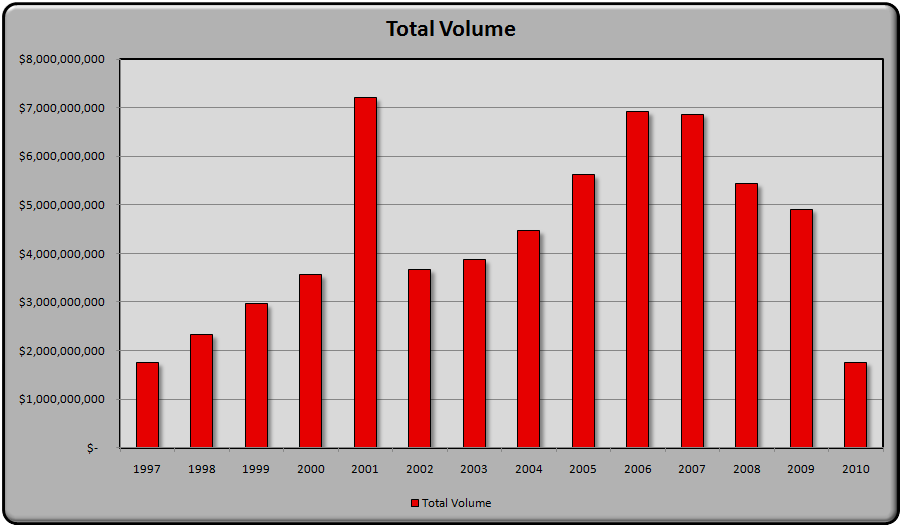
10 Year Gross Sales in $
This graph shows the 10 year
total gross sales volume in dollars for the Austin real estate
market. The $7.2B peak occurred in 2001. Both 2006
and 2007 numbers were very near the peak at $6.9B and $6.8B
respectively.
In 2009, there was $4.9B in total gross homes sales.
Expect 2010 numbers to be near 2009 numbers.
Data source: Austin MLS