Austin Real Estate Market Update January 2026: Why the “Sold Over List” Stat is Lying to You

allen@shipmanpartners.com
Published February 6th, 2026
The January 2026 Snapshot: A Tale of Two Markets
The January data for the Austin MSA is officially in, and if you only look at the surface, you might be confused. We are seeing homes sell for 103.5% of their list price, yet the Median Sold Price has dipped to $400,000 (down from nearly $410,000 this time last year).
What does this mean for you? It means the Austin market has shifted into a “Strategic Pricing” phase. Sellers are no longer testing the ceiling; they are pricing to move, and buyers are finally finding the leverage they’ve waited years for.

The TL;DR: January by the Numbers
Median Sold Price: $400,000 (A 2.4% decrease YoY)
Average Days on Market: 90 Days (Giving buyers more time to breathe)
Months of Inventory: 6.6 Months (Official Buyer’s Market Territory)
The “Price Drop” Reality: 64.4% of all homes sold in January had at least one price reduction before finding a buyer.
The takeaway: Buyers are getting better values; they’re just competing for the homes that are priced most aggressively.
Where is the Heat? The "Hot 3" Zip Codes
While the broader Austin MSA is cooling, these three pockets remained exceptionally resilient in January:
78735 (Oak Hill/Southwest Austin): The fastest-moving zip code with a Median DOM of just 15 days.
78729 (Jollyville/North Austin): A favorite for tech commuters, showing high volume and a 25-day Median DOM.
78739 (Circle C): Still the gold standard for South Austin, with homes averaging 28 days on market.
Currently Available Homes in the Hottest 3 Zip Codes!
No Results Found.
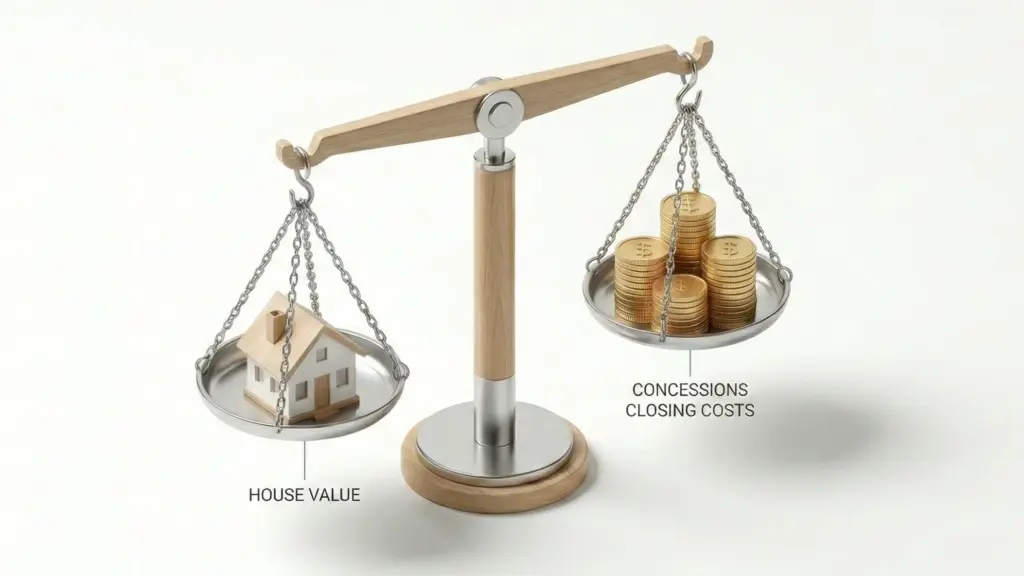
The Power of the Buyer: Concessions & Inventory
With 10,168 active listings across the 72 zip codes we track, inventory is at a multi-year high. This has forced a massive shift in how deals are structured:
Seller Concessions: 52% of all January sales included seller-paid concessions.
The “Closing Cost” Credit: On average, sellers contributed $11,024 toward buyer closing costs or mortgage rate buy-downs.
If you are a buyer, your “walk-in” cost is lower today than it has been in years because sellers are willing to pay to get the deal done.
New Construction vs. Resale
Nearly 30% of all homes sold in January were brand-new builds. Builders are currently the “Market Makers” in Austin, offering aggressive financing incentives that many resale sellers are now having to match.
New Construction Under $500K
No Results Found.
What’s Next for February?
We are firmly in a Buyer’s Market with 6.6 months of inventory. For sellers, the message is clear: your first price must be your best price. For buyers, the “holding pattern” is over—with 64% of sellers dropping prices and over half offering concessions, the window of opportunity is wide open.
Want to know the specific stats for your neighborhood?
(Drop a note in the request asking for “Stats” and include your address.)
Schedule a Listing Consultation:
About Shipman Partners
Shipman Partners is a boutique family-owned real estate brokerage serving the Austin metro area since 2010. We bring an analytical, client-focused approach to luxury real estate, combining decades of experience with hands-on market knowledge. Whether buying or selling, we’re committed to providing personalized service and data-driven guidance.
Contact us today to discuss your real estate needs in Austin.
Data Source & Methodology
The data presented in this analysis comes from sold listings reported through Unlock MLS, the multiple listing service operated by the Austin Board of Realtors. This comprehensive dataset covers 72 zip codes representing the majority of the Austin Metropolitan Statistical Area (MSA) and includes all home sales that closed during the month of January 2026. It’s important to note that this analysis reflects MLS-reported transactions only. Private sales that occurred off-market and were not reported through Unlock MLS are not included in these figures. While care has been taken to ensure data accuracy, minor discrepancies may exist due to system reporting variations or human error in the original listings. For buyers and sellers, this means the actual number of transactions may be higher when accounting for off-market deals. However, MLS data provides the most comprehensive and reliable view of Austin’s real estate market, representing the vast majority of transactions.