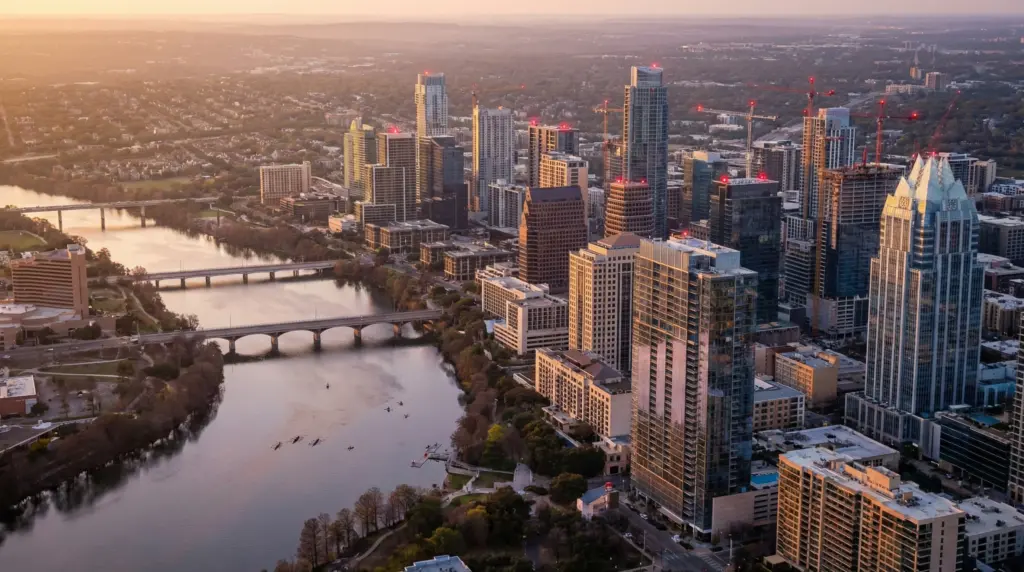
Austin Housing Affordability:
The 30-Year Reckoning
The data-backed truth about where Austin home prices have been, where they're going, and why the most expensive decision you can make is waiting on the sidelines.
Published February 23th, 2026 (Updated 3/9/26)
By Shipman Partners Real Estate • Austin-Round Rock-San Marcos MSA • Data: 1996–2026
TL;DR - EXECUTIVE SUMMARY
The Bottom Line in 60 Seconds
- 30 years, one trend: Austin home prices have grown at 5% annually versus 3.3% for median income. Compounded over three decades, that gap transformed a $105,500 starter home into a $400,000+ purchase.
- The peak and the correction: Prices peaked at $501,000 in 2022 and have corrected to ~$400,000. This is normalization backed by a $25B+ investment floor, not a crash.
- The affordability myth: At $400k, Austin is still 50% cheaper than San Francisco, Seattle, or New York with no state income tax. The "unaffordable" narrative is media-driven, not data-driven.
- The cost of waiting is enormous: Every 2 years of sideline-sitting costs a prospective buyer an estimated $106,700 in lost appreciation, rent, and equity paydown.
- The new path to ownership: The era of the $250k move-in-ready starter home is over. The smart path runs through smaller footprints, ADUs/townhomes, and sweat equity on undervalued properties.
- The supply math is brutal: Austin needs 750,000–800,000 new housing units by 2050. Builders are slowing starts. The gap will widen, and prices will follow.
Section 1 of 10
The 30-Year Story: How Austin Went from Affordable to Aspirational
In 1996, the median Austin home sold for $105,500. A household earning the median income of $37,200 could purchase that home with a monthly payment representing roughly 30% of their take-home pay. That equilibrium no longer exists.
The Austin-Round Rock-San Marcos MSA has undergone one of the most dramatic housing affordability transformations of any major American metro in the past three decades. What began as a modest Sun Belt city with affordable housing options has evolved into a global tier-1 city in the making, with a price tag to match.
The most fundamental data point is the divergence between home price growth and income growth. From 1996 to 2025, the Compound Annual Growth Rate (CAGR) for the median sold price was 5.0%. The CAGR for median household income? Just 3.3%. A 1.7% annual gap sounds manageable until you compound it over 30 years.
The result: a home that was approximately 2.8x the median annual income in 1996 now costs 5.5x the median annual income in 2026. The ladder got taller while the rungs stayed the same distance apart.
PRICE GROWTH VS. INCOME GROWTH VS. RENT GROWTH (INDEX: 1996 = 100)
Austin-Round Rock MSA, 1996–2026. Source: Austin MLS, U.S. Census Bureau, BLS.
It is worth noting: rents have increased at essentially the same pace as home prices, approximately 5% annually, compared to 4.7% CAGR for the median rent. There is no “safe haven” from Austin’s housing cost escalation. Renting is not a pause on the clock; it is an acceleration of wealth loss.
"The question isn't whether Austin housing is affordable. The real question is whether you can afford to be standing on the sidelines when home values double again over the next decade."
- Allen Shipman, Broker/Co-Founder, Shipman Partners Tweet
Section 2 of 10
The Perfect Storm: The 2021–2024 Affordability Crisis
Between 2020 and 2022, Austin became the epicenter of America’s pandemic-era housing mania. What happened next serves as the definitive case study in how quickly a market can become untethered from local economic reality.
Three forces converged simultaneously between 2020 and 2023, creating an unprecedented affordability crisis:
Remote work migration -
brought a wave of high-income tech workers from California, New York, and Washington who could afford to outbid locals at nearly any price point.
Record-low mortgage rates -
(2.96% in 2021) temporarily masked inflated prices by keeping monthly payments manageable, creating a buying frenzy.
Institutional investors -
hedge funds, iBuyers, and Wall Street landlords captured as much as 20–30% of sales in certain Austin ZIP codes at the peak, outbidding families with all-cash offers.
MEDIAN MONTHLY MORTGAGE PAYMENT AS % OF MEDIAN HOUSEHOLD INCOME
Austin MSA, 1996–2026. The critical 30% threshold is the traditional "affordability ceiling."
The result: by 2022, the median monthly mortgage payment consumed 52.5% of the median Austin household income nearly double the traditional affordability benchmark of 30%. This was not a sustainable condition. The market responded with a correction.
The Rate Shock
Even as home prices peaked and began declining in 2023, the Federal Reserve’s aggressive rate-hiking campaign meant that the monthly payment barely moved. The median monthly P&I payment nearly doubled between 2021 and 2023, from $2,143 to $3,898, even as the median price fell from $501,000 to $438,000.
Where Are We Now? (February 2026)
The market is in an active corrective phase. Inventory has normalized to a 6.6 months of supply, officially a buyer’s market. Days on Market have extended to approximately 90 days, giving buyers more leverage than they have had since 2019. The 64.4% of homes that required at least one price reduction before going under contract tells you that the era of sellers dictating terms is over, for now.
This is the window. The correction has done its job. The structural forces driving long-term appreciation, infrastructure investment, corporate migration, and population growth are unchanged or accelerating.
Section 3 of 10
Demographic Shifts: The Changing Face of the Austin Buyer
The affordability crisis has done more than change prices. It has fundamentally changed who buys homes in Austin and who gets left behind.
MEDIAN AGE OF AUSTIN MSA HOME BUYERS, 1996–2026
The buyer pool is aging as younger and first-time buyers face rising entry barriers.
The Aging Buyer Pool
In 1996, the median age of an Austin home buyer was 36 years old. By 2024, that number had climbed to 56, with 2026 projections approaching 59. This dramatic shift reflects a market where first-time and younger buyers are increasingly sidelined, replaced by older, more financially established households who bring existing equity, stronger credit, higher savings rates, and greater psychological resilience against the “affordability narrative” amplified by mainstream media.
Importantly, the Austin buyer is likely younger than the national average, reflecting the city’s culture and continued appeal to young professionals, but even Austin’s buyers are aging at a rapid clip.
The Tenure Trap: Nobody's Moving
Median homeowner tenure in Austin has risen from 7.2 years in 1996 to a peak of 13.5 years in 2020, settling at roughly 12 years today. Two forces are at work:
The Rate Lock Effect:
Homeowners with 3% mortgages from 2020–2021 are not giving them up willingly. Moving means adopting a 7%+ rate on a higher-priced home, a financial step backward for many.
The Tax Protection Effect:
Texas homeowners who have accumulated years under the Homestead Exemption and (for those 65+) a school tax ceiling are effectively “frozen” in a favorable tax position. Selling means losing that protection entirely.
The result is a market with structurally constrained supply. The homes that do come to market are disproportionately priced at the high end, further squeezing out the first-time buyer.
The Rise of the Single-Person Homeowner
Single-person households as a share of owner-occupied homes have risen steadily from 15.8% in 1996 to a projected 22.9% in 2026. People are delaying marriage (or forgoing it entirely), yet the desire for homeownership and its equity and tax benefits has not diminished. This demographic group is the most likely driver of demand for smaller footprints: townhomes, condos, and ADUs in accessible urban locations.
Location is Everything.

Section 4 of 10
The True Cost of Ownership: Texas Taxes, Exemptions & the Owner's Advantage
The mortgage payment is only part of the affordability picture in Texas. Because the state levies no income tax, property taxes do the heavy lifting, and they’ve grown dramatically. But the Texas Legislature has responded with protections that create a significant, quantifiable advantage for homeowners over renters.
The Property Tax Reality
In 1996, a property tax rate of approximately 2.2% on a $105,500 median home translated to about $2,300 per year, or $192 per month. In 2026, that same rate on a $400,000 home produces a gross tax obligation of $8,400 per year ($700/month) before exemptions.
This “tax-driven displacement” is a genuine force affecting long-term Austin residents, particularly seniors on fixed incomes who watched their neighborhood’s assessed values triple while their income remained flat. It is also a primary reason why some homeowners feel compelled to sell, converting owner-occupied homes into investor-owned rentals, reducing available inventory for families.
The Homestead Exemption: The Owner's Secret Weapon
As of February 2026, following SB 4 (passed by Texas voters, November 2025), the standard school district homestead exemption was raised to $140,000. This is the single most valuable financial protection available to Texas homeowners, and it is one that renters never access.
| Tax Component | Without Exemption | With 2026 Exemptions | Monthly Savings |
|---|---|---|---|
| School District (ISD) Tax | $4,400/yr (1.1% of $400k) | $2,860/yr (1.1% of $260k taxable) | ~$128/mo |
| City + County Tax | $4,000/yr (~1.0% of $400k) | $3,200/yr (1.0% of $320k, 20% exemption) | ~$67/mo |
| Total Annual Tax | $8,400/yr | $6,060/yr | ~$195/mo saved |
The $195/month in tax savings effectively offsets approximately 1.5% in mortgage interest rate. Practically speaking, a homeowner with the full Homestead Exemption on a $400,000 home is paying an effective financing cost equivalent to someone with a rate 1.5% lower than their actual rate, a benefit renters simply do not receive.
Senior Protections: The Tax Freeze
For homeowners who reach age 65, the school district property tax is frozen at the dollar amount paid the year they qualify. Even if Austin’s home values double again over the next 15 years, their school tax bill remains static. This is why we see longer tenure among older homeowners, the math for staying is overwhelming.
There is currently a legislative push (announced in late 2025 as “Operation Double Nickel”) to lower this freeze age from 65 to 55. If passed, it would provide effective school tax reductions for over 3 million Texas homeowners and will likely extend tenure statistics even further.
The Regulatory Tax: What It Costs to Build
It is not just market forces keeping home prices elevated. The cost to deliver a new home in Austin has risen significantly due to regulatory burdens:
- The City of Austin increased certain site plan review fees by over 200% for FY 2025–26.
- It now costs an average of $15,000–$25,000 more in pure municipal fees and regulatory "time-cost" to deliver a single-family home than it did in 2020.
- When land cost, fees, and materials are combined, it is structurally impossible for a builder to profitably construct a new single-family home under $350,000 in most Austin locations, setting a permanent price floor that prevents a return to pre-2016 pricing.
"Austin has separated into two economies. The Renter Economy faces high turnover, rising costs, and zero tax protection. The Homestead Economy is shielded by $140k exemptions, senior tax freezes, and new federal protections against institutional competition. The divergence widens every year."
- Shipman Partners Market Analysis, February 2026 Tweet
Section 5 of 10
The Geographic Shift: When the Starter Home Moved to Bastrop
The story of Austin affordability is, at its core, a story of distance. Over 30 years, the “starter home” has moved from 15 miles outside downtown to 40 miles out and the social, financial, and environmental costs of that migration are enormous.
No single ZIP code illustrates Austin’s affordability transformation more vividly than 78702 (East Austin). Once a working-class neighborhood east of I-35, it has undergone a complete economic reinvention. The data is stark:
| Period | Avg. Annual Sales | Average Sold Price |
|---|---|---|
| 2005–2014 | 267 homes/yr | $229,000 |
| 2015–2024 | 449 homes/yr (+68%) | $557,000 (+143%) |
| 2025 (Current) | 320 homes/yr | $760,000 (+232%) |
In just over a decade, the average price in 78702 jumped from $229,000 to $760,000, a 232% increase. This trajectory is not aberrant; it is the logical result of geographic constraint (can’t build west), infrastructure (the I-35 “Cap & Stitch” will connect East to West Austin), and corporate demand from nearby employers.
The Commute Trade-Off: A Hidden Tax
Many buyers believe they are “saving money” by purchasing a less expensive home further from the city center. The math often tells a different story. Using the IRS standard mileage rate and accounting for time cost, a 84-mile round-trip commute carries an annual cost of approximately $16,000:
| Factor | 78723 - Mueller Area(5 mi) | Jarrell (42+ mi) |
|---|---|---|
| Approx. Median Price | $600,000 | $275,000 |
| Monthly Mortgage (at 6.1%) | $3,400 | $1,600 |
| Annual Commute Cost (IRS rate) | ~$1,900 | ~$16,000 |
| Effective Monthly Cost Difference | The "savings" can shrink to $500-$600/mo before factoring in time value | |
For many commuters, particularly those with children, the calculation is even less favorable. A 90-minute one-way commute represents 15 hours of personal time per week that cannot be recovered. This is a primary driver of demand for in-core locations, and a primary reason inner-core prices remain resistant to correction even in a broadly softening market.
The HOME Initiative: The New Density Play
The City of Austin’s HOME Phase 2 Initiative (adopted February 2026) now allows up to 3 residential units on what were previously single-family lots across the city. This change, combined with Austin’s strong demand for smaller footprints from the growing single-person household cohort, is beginning to create a new class of housing: townhomes, triplexes, and ADU clusters in locations that were previously locked into single-family zoning.
This is the most significant structural affordability improvement Austin has seen in decades, and buyers who identify properties suitable for ADU development are, in effect, acquiring embedded future value.
Section 6 of 10
The $25 Billion Floor: Why This Is Not a Speculative Bubble
The single most important distinction between Austin’s growth story and a speculative bubble is this: the investment is fixed, tangible, and already breaking ground. You cannot pour $4.5 billion in concrete and then decide the market isn’t worth it.
Since 2024, a staggering volume of capital has been committed to the Austin-Round Rock MSA. The following represents only the confirmed, announced projects meeting a threshold of $25M+ in CapEx or 200+ permanent jobs:
| Sector | Project / Company | Location | Investment | Jobs / Impact |
|---|---|---|---|---|
| Infrastructure | I-35 Capital Express Central | Travis County | $4.5B | Under Construction; "Cap & Stitch" adds 25 acres of new parkland over highway |
| Infrastructure | ABIA "Journey With AUS" Expansion | Travis County | $4.8B program | Doubling gate capacity to 60+ gates for 30M passengers/yr |
| Infrastructure | Project Connect Light Rail | Travis County | $7.1B | Construction 2027, service 2033; drives transit-oriented density |
| Civic | Austin Convention Center Rebuild | Downtown Austin | $1.6B | World's first zero-carbon convention center; 620K sq. ft.; opens 2029 |
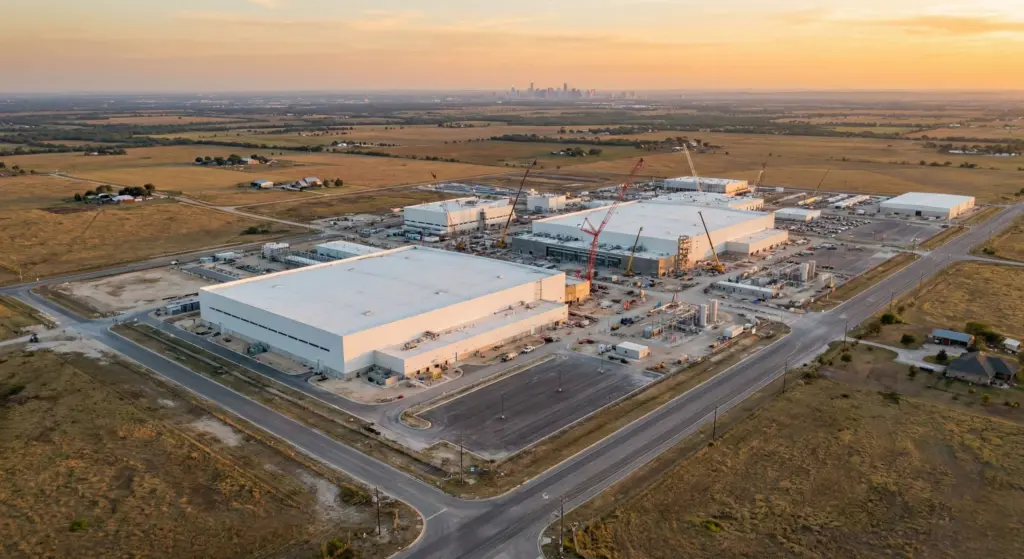
| Tech/Semiconductor | Samsung FAB Expansion | Taylor (Williamson Co.) | Global-scale | Operational 2026; anchor of Silicon Spine |
| AI/Data Center | Blueprint Data Centers | Taylor/Georgetown | 85MW AI-ready campuses | Part of Texas becoming the #1 U.S. data center market by 2028 |
| Manufacturing | Compal Manufacturing | Taylor + Georgetown | $235M+ | 1,000+ jobs; suburban live-work catalyst |
| Life Sciences | BillionToOne "Forever Lab" | North Austin | $44.5M ($105M total development) | 1,000+ high-wage life sciences jobs |
| HQ Relocation | Realtor.com HQ | Travis County | - | 400+ Austin employees; "hundreds more" planned |
| Aerospace / HQ | X (Twitter) + SpaceX | Bastrop County | $280M (SpaceX) | Eastern MSA anchor; drives Bastrop corridor |
| Aerospace | Firefly Aerospace HQ Expansion | Cedar Park | N/A disclosed | 300+ jobs by end of 2027 |
| Manufacturing | Pegatron U.S. Facility | Georgetown | $35M+ | 100 jobs (within 3 years) |
The Job-to-Housing Math
The 6,000+ permanent jobs announced in the last 12 months alone require, at a standard 2.5 persons per household, approximately 2,400 new housing units. These are high-wage positions in semiconductor manufacturing, life sciences, AI infrastructure, and aerospace, not retail or service roles. The employees filling these positions will be competing for Austin-area housing.
Meanwhile, builders are actively slowing construction starts in response to interest rate uncertainty and margin compression. The result is a “pressure cooker” dynamic: fixed and growing demand colliding with constrained and declining supply. This is precisely the environment in which home values accelerate.
"Austin is no longer just growing outward. It is being structurally rebuilt to handle a much higher density and the investment that supports this rebuild is fixed capital that cannot be undeployed."
- Shipman Partners Market Analysis, February 2026 Tweet
Section 7 of 10
Austin's Population Trajectory: The Numbers Behind the Growth
Austin has been predicted to “slow down” for 30 consecutive years. It has not. Understanding the population projections is essential context for any decision about when to buy.
AUSTIN MSA POPULATION PROJECTIONS: 2025-2050
Three scenarios: Historical CAGR (3.11%), TDC Mid-Migration (Baseline), TDC Low-Migration (Conservative). Current population: ~2.4M.
Even the most conservative projection, a meaningful slowdown in domestic migration, adds over one million new residents to the Austin MSA by 2050. That is equivalent to importing another City of Austin. To house those residents at today’s average household size, the region will need approximately 750,000 to 800,000 additional housing units.
The most likely scenario (the Texas Demographic Center’s mid-migration forecast) projects 4.37 million residents by 2050. If Austin continues its historical 3.11% CAGR, which it has maintained consistently through recessions, pandemics, and two real estate corrections, the metro reaches 5.61 million by 2050.
The confluence of major infrastructure investment (ABIA, I-35, Project Connect), semiconductor manufacturing (Samsung Taylor, Compal, Pegatron), and AI data center development (Texas on pace to become the #1 U.S. data center market by 2028) suggests the historical CAGR scenario is more likely than the conservative case. Austin has consistently surprised to the upside. There is no compelling structural reason that trend will reverse.
Section 8 of 10
The Cost of Waiting: A Decade-by-Decade Wealth Impact
The most common response to a complex housing market is paralysis. But before you decide to wait, you deserve to see the full math not just the rosy version.
Most “rent vs. buy” analyses stack the deck in favor of buying by pretending the homeowner’s interest, taxes, insurance, and maintenance do not exist. This analysis does not do that. Every dollar that leaves the owner’s pocket and never comes back is tracked and counted. The same intellectual honesty is applied to the renter: we assume a disciplined renter takes the $20,000 down payment and $8,000 in closing costs they did not spend, invests that $28,000 in an index fund at 7% CAGR, and continues investing their monthly savings every single month.
Under those conditions, the most favorable possible scenario for the renter, ownership still wins decisively by Year 10, and the gap widens every year after that.
But here is the reality that the spreadsheet cannot capture: most renters do not have that discipline. The down payment gets spent. The monthly savings disappear into daily life. The S&P 500 account never gets opened. Below, you will see both scenarios side by side — because the difference between them is the difference between a $394,000 portfolio and $0.
Head-to-Head Results: 5, 10, 15, and 20 Years
| Metric | Year 5 | Year 10 | Year 15 | Year 20 |
|---|---|---|---|---|
| Home Value | $510,513 | $651,558 | $831,571 | $1,061,319 |
| Owner: Total Sunk Costs | $225,892 | $429,520 | $646,016 | $877,565 |
| -- Interest | $119,833 | $230,372 | $328,059 | $407,974 |
| -- Property Taxes | $33,154 | $75,467 | $129,471 | $198,396 |
| -- Insurance | $11,051 | $25,156 | $43,157 | $66,132 |
| -- Maintenance (1%/yr) | $22,103 | $50,312 | $86,314 | $132,264 |
| -- PMI + Selling Costs | $39,751 | $48,213 | $59,014 | $72,799 |
| Renter: Total Rent Paid | $151,596 | $342,327 | $582,296 | $884,214 |
| Owner Net Wealth at Exit | $124,160 | $290,315 | $505,952 | $786,112 |
| Renter Net Wealth -- Disciplined Investor | $122,131 | $219,256 | $326,275 | $439,907 |
| Renter Net Wealth -- Typical Renter (No Investment) | $0 | $0 | $0 | $0 |
| Owner Advantage vs. Disciplined Investor | $2,029 | $71,059 | $179,677 | $346,204 |
| Owner Advantage vs. Typical Renter | $124,160 | $290,315 | $505,952 | $786,112 |
What These Numbers Mean
- Year 5 is the danger zone. After just 5 years, the owner advantage against a disciplined investor is only $2,029. If you plan to sell within 5 years, the transaction costs and interest front-loading make ownership a close call. Austin ownership is a long-term strategy, not a short-term flip.
- Year 10 is the inflection point. By Year 10 the owner advantage reaches $71,059 against the disciplined investor -- and $290,315 against the typical renter who did not invest their savings. The compounding gap only widens after this.
- By Year 15, rent surpasses the owner's total monthly cost. Even though the owner is paying interest, taxes, insurance, and maintenance, the renter's payment -- growing at 4.7% per year -- eventually exceeds it. The owner's cost is essentially fixed. The renter's cost never stops climbing.
- The discipline gap is the real story. The difference between the Disciplined Investor renter ($439,907) and the Typical Renter ($0) after 20 years is $439,907 -- a gap created entirely by behavior, not market conditions. Most renters fall into the second category.
NET WEALTH COMPARISON: OWNER VS. RENTER OVER 20 YEARS
Assumptions: $400,000 purchase, 5% down, 6.5% rate, 5% annual appreciation, $2,300/mo rent growing at 4.7%/yr, $140K homestead exemption applied, renter invests $28,000 + monthly savings at 7% CAGR (Scenario A only). Source: Shipman Partners model based on Austin MSA historical data.
The “Cost of Waiting” is not merely lost appreciation. It is a composite of four separate financial losses that compound simultaneously:
The Rate-Drop Lever
Many buyers are waiting for mortgage rates to fall. Here is the critical insight: a 1% drop in interest rates is equivalent to a $40,000 price reduction in terms of your monthly payment on a $400,000 home. If rates drop from 7% to 6%, you can afford approximately 10% more house for the same payment. But if rates drop and prices simultaneously rise, which historical data suggests happens during rate-drop cycles, the math favors those who bought before the crowd returned.
Peer City Benchmark: Relative Affordability
The “Austin is too expensive” narrative deserves to be measured against the cities Austin now competes with for talent:
| City | The Case Against Buying | The Case for Buying in Austin |
|---|---|---|
| San Jose / Silicon Valley | Austin is "expensive" at $400k median | San Jose median: ~$1.4M. Austin is 71% less expensive. |
| Seattle | Austin prices have risen too far | Seattle median: ~$850K. Austin is 53% less, with no state income tax. |
| Denver | Austin has no room to grow | Denver median: ~$575K, with state income tax. Austin offers better value per dollar. |
| San Antonio / Dallas | Other Texas cities are cheaper | True, but neither city is absorbing $25B+ in tech/infra investment or growing at 3.1% annually. |
Setting the Record Straight
The "Austin Bubble Is Bursting" Narrative - Debunked with Data
There is a persistent, media-amplified story that Austin is in freefall and that the pandemic surge was artificial, the correction is accelerating, and that buyers who wait will be rewarded with 2019 prices. Every data point in this case study contradicts that story. Let’s take it apart, claim by claim.
| The Narrative | What the Data Actually Shows |
|---|---|
| Austin prices are crashing back to pre-pandemic levels. | The median price has corrected from $501,000 (2022 peak) to $400,000, a 20% correction, not a crash. Even at $400K, prices are still 46% above the 2019 median of $274,000. A 20% correction from a 100%+ runup is called normalization, not a collapse. And it has already happened. The floor is here. |
| The tech layoffs killed Austin demand. | The employer base that drove Austin's pandemic surge has been structurally replaced and diversified. Samsung, Compal, BillionToOne, Realtor.com, SpaceX, Firefly; these are not Zoom boom companies. They are fixed-capital manufacturing, life sciences, and aerospace employers building physical facilities that take years to construct and decades to depreciate. The "tech" Austin of 2020 was reliant on one sector. The Austin of 2026 has six. |
| Inventory is up, buyers have all the leverage now. | Yes, 6 months of inventory is a buyer's market by definition. But this is the opportunity, not the warning sign. The last time Austin had this much inventory was 2011, immediately before a 10-year period of near-uninterrupted appreciation. Buyers who used "high inventory" as a reason to wait in 2011 paid $200,000 more for the same house by 2016. |
| Interest rates will stay high and prices will keep falling. | Rates are a lever, not a ceiling. If the Fed cuts rates by 100bps, buying power on a $400K home increases by ~$40,000. When that happens, the same buyers currently "waiting" will flood back into the market simultaneously, competing against each other for the same limited inventory. Those who bought during the high-rate window will hold the best assets at the lowest acquisition prices. |
| The Austin bubble was driven by hype, there's no real economy here. | The Austin economy of 2026 is backed by $4.5B in highway construction, $4.8B in airport expansion, $7.1B in light rail, and $60B+ in semiconductor and AI data center investment. These are physical assets. Concrete has been poured. Cranes are in the air. The "hype" argument fails to account for the difference between a speculative narrative and fixed capital already deployed. |
| Builders are overbuilding, supply will catch up and crush prices. | The opposite is true. Builders pulled back construction starts in 2023–2025 due to rate uncertainty and margin compression. The pipeline that would have added supply in 2026–2028 was never started. Meanwhile, 6,000+ new high-wage jobs were announced in 2024–2025 alone, each requiring housing. The supply deficit is widening, not closing. |
"Every single time in last 30-years that observers declared that Austin's growth story 'over' in 2001, in 2008, in 2015, in 2020, the market resumed its trajectory within 24 months and those who waited lost compounding years of equity. The data does not support a fourth exception."
- Shipman Partners Market Analysis, February 2026 Tweet
AUSTIN MEDIAN SOLD PRICE: 30-YEAR HISTORY WITH PRIOR CORRECTIONS HIGHLIGHTED
Every correction in Austin's history has been followed by a new, higher price floor. The 2022-2026 correction is following the same pattern. Source: Austin MLS / ABoR.
The "Permanent Bubble" Test: Five Reasons Austin Is Different
A true speculative bubble, think Las Vegas 2006 or Phoenix 2007, is characterized by demand driven by investor speculation, no underlying population growth, no employment anchor, and no geographic constraint on supply. Austin fails every single bubble criterion:
Population
Austin adds ~70,000–80,000 new residents annually. Las Vegas lost population during its 2008 crash. This is not a bubble city, it is a migration destination.
Employment
$60B+ in fixed-capital tech and manufacturing investment means employers are physically anchored here. They cannot "move the jobs remote" once a $4.5B FAB is built.
Geography
Lake Travis, the Hill Country, and the Edwards Aquifer cap westward expansion permanently. There is no Phoenix-style limitless suburban growth available. Constraint = price support.
Tax Policy
No state income tax, a $140K homestead exemption, and senior tax protections create economic incentives that actively retain residents. Austin is structurally designed to keep people.
To check Austin’s current market conditions in real time, including active inventory levels, median prices by ZIP code, and days on market, visit our live Austin Market Statistics page. The data speaks louder than any headline.

Section 9 of 10
The Global Value Play: Austin vs. The Top 50
The "Texas Premium" is a National Bargain
While it’s easy to look at a $465,100 median price and feel “Texas sticker shock,” the data suggests that Austin is actually a massive value play on the national stage. In a comprehensive analysis of the Top 50 MSAs in the U.S., Austin’s Price-to-Income Ratio of 4.90 is significantly lower than the Top 50 National Average of 5.49. Despite being the most expensive major market in Texas, Austin’s high-income floor, (a median of $95,000) acts as a structural buffer. For the first time in its history, Austin has decoupled from the “Cheap Texas” narrative and emerged as a more affordable, higher-growth alternative to the national average.
The Arbitrage Reality: Why the "Coastal Flight" Won’t Stop
To understand why Austin home values have a permanent floor, you have to look at the “Arbitrage Reality” facing a buyer from San Jose or San Francisco. In San Jose, the Price-to-Income ratio sits at a staggering 13.2, with a median home price of $2.02M. To a Silicon Valley engineer, relocating to the Silicon Hills effectively triples their housing purchasing power overnight. This isn’t just a relocation; it’s a massive lifestyle subsidy. As long as this “Affordability Arbitrage” exists, Austin will continue to absorb the most mobile and highest-earning talent in the global economy, keeping demand relentless even in high-rate environments.
Growth Velocity: A League of One
The most staggering data point in the Top 50 comparison is Austin’s 3.30% annualized growth rate since 1990. This is more than 2.5x the national average for top-tier metros. While peers like Dallas (2.3%) and Phoenix (2.5%) are growing fast, Austin is moving at a velocity that defies traditional “cycle” logic. In the world of real estate, growth is the ultimate hedge against correction. When you combine the fastest growth in the country with a Price-to-Income ratio that is still 10% below the national average, you aren’t looking at a bubble, you’re looking at a market that is still remarkably undervalued.
Housing Affordability Index: Austin vs. National Peers
The Affordability Arbitrage (2025)
Data: Shipman Partners MSA Comparison (March 2025). Price-to-Income Ratio = Median Home Price / Median Household Income. Higher numbers indicate lower affordability.
Section 10 of 10
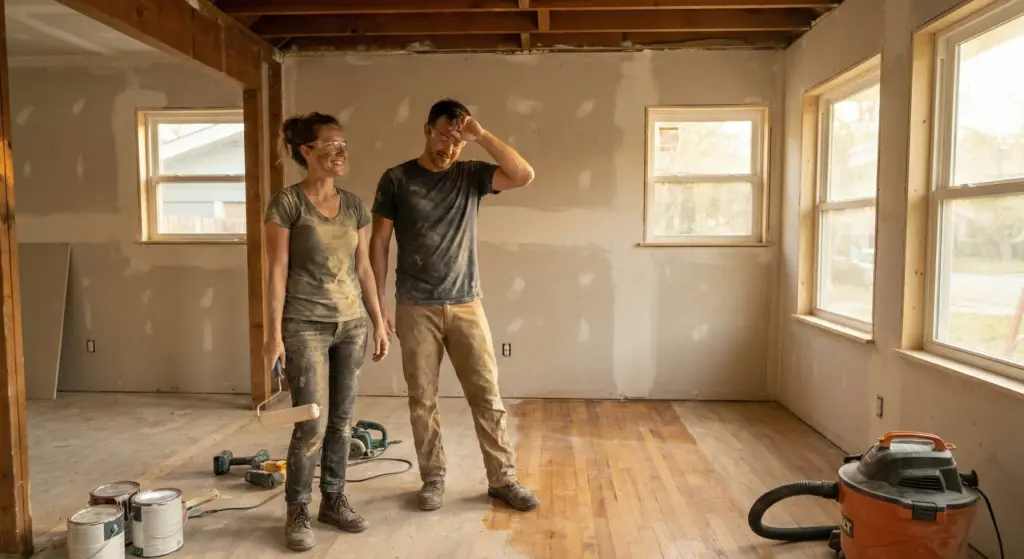
The Sweat Equity Opportunity & Austin's Three Hot Zones
As the era of the affordable turn-key home ends, a new class of opportunity opens: the “Visionary Buyer” who captures equity through renovation that institutions once monopolized.
The Sweat Equity Thesis
For years, professional developers and institutional flippers have captured the value that once belonged to individual homeowners. They bought the unrenovated 1970s ranch house at $350,000, put $80,000 into it, and sold it as a “turn-key” home for $550,000 pocketing the $120,000 premium that the average buyer paid for the privilege of an Instagram-ready home on day one.
As a 52% payment-to-income ratio proved unsustainable and institutional buying is now restricted by the January 2026 Executive Order, this window is reopening for individual buyers. The median $/sqft has grown at only 3.4% annually versus 5% for total price, meaning the premium for size and finish is where the value is concentrated, not necessarily in the land or the bones of the home.
Buyers willing to accept a smaller footprint and/or invest labor in a renovation project are the ones positioned to own the equity growth of the next cycle, just as the true owners of the 1996–2016 run were those who bought before the amenity premium became the expected baseline.
Austin's Three Belts of Growth: Hot Zones for 2026–2036
Belt 1: The Silicon Corridor (Williamson County)
Belt 2: The Innovation Core (Travis County / North Austin)
Belt 3: The Logistics / Space Frontier (Bastrop / Caldwell)
ZIP CODE 78702 (EAST AUSTIN): PRICE TRANSFORMATION, 2005-2025
Gentrification in numbers -- and a roadmap for where Belt 3 is headed.
Looking Ahead
Top 10 Predictions for the Austin MSA by 2030
Based on 30 years of data, $25B in committed capital, and the structural forces shaping Austin’s trajectory, these are the ten most consequential predictions for the next five years.
-
1
The Austin-Taylor Silicon Spine becomes a globally recognized semiconductor powerhouse.
Anchored by Samsung, Compal, Pegatron, Blueprint Data Centers, and a growing supply-chain cluster, the Williamson County corridor will be referenced alongside Phoenix/TSMC and Columbus/Intel as America's reindustrialization success stories. -
2
Georgetown, Taylor, Cedar Park, and Pflugerville emerge as genuine self-sustaining Edge Cities.
As major employers concentrate in Williamson County, these former bedroom communities develop independent ecosystems. The 60-minute Austin commute becomes optional and land values re-rate upward accordingly. -
3
Austin's population surpasses 3 million, triggering the Austin-San Antonio Mega-Metro convergence.
As the I-35 corridor between the two metros densifies, national employers and investors will treat them as a single economic region elevating Austin into the top-5 U.S. economic hubs, with the property values to match. -
4
Southeast Austin, anchored by COTA and Formula 1, establishes itself as Austin's permanent luxury and short-term rental investment district.
As COTA's calendar expands and surrounding development matures, Southeast Austin cements its identity as a destination neighborhood driving year-round hospitality and luxury residential demand. -
5
ZIP 78702 reaches price parity with West Austin.
The I-35 "Cap & Stitch" - 25 acres of parkland built over the sunken highway, physically reconnects East and West Austin for the first time in generations. Combined with existing gentrification, 78702's $760K+ average is on a direct path to West Austin territory by 2030. -
6
Townhomes, ADUs, and sub-1,500 sq ft homes replace the 1/4-acre suburban build as the primary homeownership entry point.
HOME Phase 2 zoning, the rise of the single-person household (approaching 23% of owner-occupied homes), and Austin land economics make the large-lot single-family starter home functionally extinct in the core MSA. -
7
West Austin cements its status as a permanent luxury moat with a price floor that consistently outpaces the broader MSA.
Lake Travis, Lake Austin, the Edwards Aquifer, and the Hill Country create an absolute hard cap on buildable land. With no path to increased supply, West Austin real estate increasingly resembles the Marin County dynamic of San Francisco. -
8
The "Visionary Buyer" class reclaims the sub-$500K market, capturing sweat equity that institutional flippers previously monopolized.
With the 2026 Executive Order restricting institutional purchases and the 30-day first-look policy favoring owner-occupants, individuals with renovation vision are positioned to capture the spread between distressed and move-in-ready pricing. -
9
Vertical density explodes along Project Connect rail corridors, transforming East Riverside, Mueller, the Domain, and Rundberg.
Properties within a half-mile of stations subject to ETOD zoning allowing 5–10 story structures will be the highest-yield residential investment in the MSA by the time rail service begins in 2033. Those who act before the rail arrives hold the best positions. -
10
A $550,000 price floor becomes the accepted reality for any move-in-ready home within the core MSA.
Regulatory costs ($15K–$25K more per home than 2020), land scarcity, high-wage labor, and sustained demand make the math immovable. The current $400K median reflects the correction window, not the long-term floor. The structural cost to build a new home already approaches or exceeds $550K in most Austin-area locations.
Ready to Stop Watching from the
Sidelines?
Thirty years of data, $25 billion in committed investment, and a population trajectory pointing to 4+ million people. Austin’s window is not waiting for market perfection. Let’s talk about what buying in Austin looks like for your specific situation, timeline, neighborhood, and budget.
Schedule a Buyers Consultation:
Or call us directly at 512-222-6958 • Available 7 days a week, 10am–8pm
About Shipman Partners
Shipman Partners is a boutique family-owned real estate brokerage serving the Austin metro area since 2010. We bring an analytical, client-focused approach to real estate, combining decades of experience with hands-on market knowledge. Whether buying or selling, we’re committed to providing personalized service and data-driven guidance.
Contact us today to discuss your real estate needs in Austin.
Data Source & Methodology
This report is published by Shipman Partners Real Estate for informational and educational purposes only. It does not constitute financial, investment, legal, or tax advice. Readers should consult with a licensed financial advisor, tax professional, or attorney before making any real estate or investment decisions.
This report contains forward-looking statements, projections, and estimates based on historical market data, publicly available information, and third-party sources believed to be reliable as of the date of publication. These forward-looking statements involve known and unknown risks, uncertainties, and other factors that may cause actual results, performance, or outcomes to differ materially from those expressed or implied. Past performance of the Austin real estate market is not a guarantee of future results. Real estate values can decline as well as appreciate, and all investments carry risk.
Population projections referenced in this report are sourced from the Texas Demographic Center and related agencies. Infrastructure and corporate investment figures are sourced from public announcements and news reporting and are subject to change. Shipman Partners makes no representation that any projected investment, development, or employment figure will be completed as announced.
Nothing in this report should be construed as a recommendation to buy, sell, or hold any real estate asset. Market conditions, interest rates, and economic factors can change rapidly and without notice. The data presented reflects conditions as of February 2026 and may not reflect subsequent market developments.
The data presented in this analysis comes from sold listings reported through Unlock MLS, the multiple listing service operated by the Austin Board of Realtors, Texas Demographic Center, U.S. Census Bureau, Bureau of Labor Statistics, Austin Contractors & Engineers Association, Texas A&M Real Estate Research Center. This comprehensive dataset covers 72 zip codes representing the majority of the Austin Metropolitan Statistical Area (MSA) and includes all home sales that closed between 1996 and 2025 calendar year. It’s important to note that this analysis reflects MLS-reported transactions only. Private sales that occurred off-market and were not reported through Unlock MLS are not included in these figures. While care has been taken to ensure data accuracy, minor discrepancies may exist due to system reporting variations or human error in the original listings. For buyers and sellers, this means the actual number of transactions may be slightly higher when accounting for off-market deals. However, MLS data provides the most comprehensive and reliable view of Austin’s real estate market, representing the vast majority of transactions.