
Shipman Partners Austin Market Report
One in Three Austin Home Listings Failed to Sell This Year. We Ranked All 72 ZIP Codes to Show You Which Side of the Market You're On.
August 2026 data. 30,593 closings analyzed. Independent MLS analysis by Shipman Partners.

Between September 2025 and August 2026, 30,593 homes sold across the Austin metro. In that same window, 16,083 listings came off the market without selling.
That number does not appear in most market reports, because most market reports only count the homes that sold. It is also the single most useful thing an Austin homeowner can know right now, because the gap between the ZIP codes where listings almost always sell and the ZIP codes where they usually do not is enormous. In Circle C, 19.9 percent of listings fail. In West Campus, 64.6 percent do. Same metro, same month, same interest rates.
This report is our attempt to map that gap honestly. We pulled 25 months of Unlock MLS data across the 72 ZIP codes we track, ran the numbers ourselves, and ranked every one of them. Some of what follows is not what sellers want to hear. We are publishing it anyway, because you cannot price a house against a story.
What this report is built on
Everything below comes from Unlock MLS records for residential sales only. No land, no leases, no commercial. Sold data covers August 2024 through August 2026. The active inventory snapshot was pulled September 8, 2026.
- Coverage: 72 ZIP codes across Travis, Williamson, Hays, Bastrop, Caldwell, and Burnet counties.
- Rankings include 66 ZIP codes. Six were excluded for having fewer than 25 closings during June through August 2026, which is too thin a sample to rank fairly.
- We use cumulative days on market rather than days on market throughout. The reason turns out to be one of the most important findings in the data, and we explain it below.
The Austin metro at a glance
| Metric | Aug 2025 | Aug 2026 | Change |
|---|---|---|---|
| Homes sold | 2,649 | 2,492 | -5.9% |
| Single family | 2,380 | 2,281 | -4.2% |
| Condo and townhome | 245 | 197 | -19.6% |
| Total dollar volume | $1.56B | $1.41B | -9.5% |
| Median sale price | $450,000 | $445,000 | -1.1% |
| Median price per square foot | $249.37 | $234.49 | -6.0% |
| Median cumulative days on market | 54.7 | 50.2 | -8.3% |
| Sold to list price | 96.33% | 95.96% | -0.37 pts |
| Sold to original list price | 91.14% | 92.81% | +1.67 pts |
| New listings taken | 3,770 | 3,494 | -7.3% |
| Listings that failed to sell | 1,845 | 1,493 | -19.1% |
| Homes on the market | 16,913 | 13,634 | -19.4% |
| Months of inventory | 6.4 | 5.5 | -0.9 |
Swipe table to see all columns
Where the market stands today: 13,245 active listings, 1,954 pending, 1,317 active under contract. Against a summer sales pace of 2,841 homes a month, that is 4.7 months of inventory.
Let's be straight about prices
Austin home prices are still falling.
Median price per square foot in August 2026 was $234.49, down 6.0 percent from August 2025. Over the trailing twelve months, price per square foot is down 3.6 percent and the median sale price is down 4.2 percent.
We use price per square foot for this rather than median sale price because median price moves when the mix of homes selling changes. If more small condos sell one month, the median drops without any individual home losing value. Price per square foot filters most of that out. It is the more honest measure, and it is currently the less flattering one.
Median Price Per Square Foot
Austin metro, 72 ZIP focus area. Two twelve month cycles, August to August.
Both years follow the same seasonal shape. A winter trough, a spring climb, a summer fade. The difference is that the entire 2026 curve sits four to six percent below the 2025 curve.
What this is, and what it is not
This is not 2008. Sales volume is up 3.9 percent year over year. Dollar volume is up 3.5 percent. Homes are selling faster than they were a year ago, not slower. There is no distress wave in this data.
What it is: a market working off an oversupply that built up over three years, and doing it through price. A four to six percent annual decline on a $450,000 home is roughly $20,000 to $27,000. Real money, and worth planning around, but not a collapse.
Finding 1: the days on market number you are looking at is probably wrong
This is the finding we would most want an Austin buyer to walk away with.
Across the metro right now, the median active listing displays 21 days on market. The median cumulative days on market for those same listings is 54 days.
The mechanism is simple. When a listing is withdrawn and relisted, the days on market counter resets to zero. Cumulative days on market does not reset. A house that sat for 90 days, came off the market for a week, and went back on last Tuesday will show six days on market on every public portal in America. Its cumulative count says 97.
The gap is widest in exactly the neighborhoods where buyers most need to know about it.
| ZIP | Area | Displayed DOM | Cumulative DOM | Multiple |
|---|---|---|---|---|
| 78705 | West Campus / UT | 5 | 70 | 14.0x |
| 78619 | Driftwood | 14 | 78 | 5.6x |
| 78759 | Northwest Hills | 13 | 67 | 5.2x |
| 76574 | Taylor | 13 | 58 | 4.5x |
| 78701 | Downtown Austin | 20 | 82 | 4.1x |
| 78741 | East Riverside | 21 | 84 | 4.0x |
| 78704 | South Congress / Zilker | 21 | 81 | 3.9x |
| 78746 | West Lake Hills | 16 | 61 | 3.8x |
| 78654 | Marble Falls | 23 | 84 | 3.7x |
Swipe table to see all columns
If you are buying
Ask your agent for the cumulative days on market before you write an offer. It is in the MLS. It is not on the portals. A seller who has been on the market four months negotiates differently than one who listed last week, and the listing will not tell you which one you are dealing with.
If you are selling
Relisting to reset your days on market counter buys you very little. Any competent buyer's agent pulls the cumulative number in about four seconds. Price correction works. Counter resetting does not.
Finding 2: the failure rate nobody publishes
Over the trailing twelve months, 34.5 percent of Austin area listings came off the market without selling. Expired, withdrawn, or cancelled.
| Region | Listing failure rate |
|---|---|
| South Corridor (Kyle, Buda, San Marcos, Lockhart) | 25.3% |
| Southwest Austin | 27.5% |
| Williamson County | 29.2% |
| North Austin | 31.7% |
| East and Southeast Austin | 37.1% |
| Bastrop and East | 38.8% |
| West Austin and Lake Travis | 43.3% |
| Central Austin | 50.5% |
In Central Austin, a listing is roughly as likely to expire as it is to close.
The five worst individual ZIP codes: 78705 West Campus at 64.6 percent, 78701 Downtown at 60.3 percent, 78669 Spicewood at 58.3 percent, 78721 East Austin at 57.5 percent, and 78741 East Riverside at 57.1 percent.
The five best: 78749 Southwest Austin at 18.4 percent, 78610 Buda at 19.9 percent, 78739 Circle C at 19.9 percent, 78728 Wells Branch at 20.3 percent, and 78633 Georgetown West and Sun City at 20.5 percent.
A failure rate is not the same thing as a bad neighborhood. Spicewood and Downtown are both desirable places to live. What a high failure rate tells you is that the gap between what sellers there are asking and what buyers there will pay is unusually wide. That is a pricing problem, and pricing problems are solvable.
The 10 ZIP codes where sellers have the most leverage
Full methodology is at the bottom of this report. In short, we score six measures rather than one, because months of inventory alone hides too much.
| Rank | ZIP | Area | Months supply | Cum. DOM | Off orig. price | Failure rate | Median price |
|---|---|---|---|---|---|---|---|
| 1 | 78739 | Circle C Ranch | 1.6 | 11 | 3.7% | 19.9% | $825,000 |
| 2 | 78749 | SW Austin / Legend Oaks | 2.5 | 18 | 3.2% | 18.4% | $575,000 |
| 3 | 78750 | Anderson Mill / Jollyville | 3.0 | 14 | 4.2% | 24.4% | $650,000 |
| 4 | 78759 | Northwest Hills / Great Hills | 2.5 | 20 | 5.3% | 28.3% | $705,000 |
| 5 | 78731 | Northwest Hills / Far West | 2.8 | 28 | 6.0% | 28.2% | $1,030,000 |
| 6 | 78737 | Belterra / Sawyer Ranch | 3.5 | 25 | 4.2% | 25.0% | $875,000 |
| 7 | 78613 | Cedar Park | 3.0 | 29 | 5.2% | 26.3% | $470,000 |
| 8 | 78735 | Barton Creek / Travis Country | 3.1 | 31 | 5.2% | 35.4% | $820,000 |
| 9 | 78727 | North Austin / Milwood | 3.6 | 14 | 4.4% | 29.0% | $515,000 |
| 10 | 78681 | Round Rock (west) | 3.9 | 22 | 4.3% | 29.2% | $495,500 |
Swipe table to see all columns
Circle C Ranch is in a category of its own
With 44 active listings against 27 sales a month, 78739 holds 1.6 months of inventory in a metro averaging 4.7. Homes go under contract in 11 cumulative days at 96.3 percent of their original asking price, and only one listing in five fails. By any historical standard that is a seller's market, and it exists inside a metro where prices are falling.
The pattern in this list is worth noticing. Seven of the ten sit in a band running from Southwest Austin up through Northwest Austin into Cedar Park and Round Rock. These are established neighborhoods with mature trees, assigned schools people move for, and almost no new construction competing against resales. That last point matters more than most sellers realize, and we come back to it below.
The 10 ZIP codes where buyers have the most leverage

| Rank | ZIP | Area | Months supply | Cum. DOM | Off orig. price | Listings cut | Median cut | Failure rate | Median price |
|---|---|---|---|---|---|---|---|---|---|
| 1 | 78669 | Spicewood | 9.0 | 83 | 12.0% | 40.3% | 7.1% | 58.3% | $638,500 |
| 2 | 78701 | Downtown Austin | 9.3 | 75 | 9.2% | 31.5% | 5.0% | 60.3% | $672,500 |
| 3 | 78654 | Marble Falls | 7.4 | 69 | 12.5% | 43.4% | 5.8% | 44.1% | $420,000 |
| 4 | 78645 | Lago Vista / Point Venture | 8.5 | 60 | 9.1% | 42.8% | 5.2% | 50.3% | $415,000 |
| 5 | 78721 | East Austin / Govalle | 8.1 | 44 | 7.6% | 46.8% | 7.1% | 57.5% | $490,000 |
| 6 | 78741 | East Riverside | 7.2 | 56 | 9.6% | 40.0% | 5.5% | 57.1% | $342,000 |
| 7 | 78702 | East Austin / Holly | 7.6 | 45 | 9.0% | 38.2% | 4.8% | 52.1% | $710,000 |
| 8 | 78705 | West Campus / UT | 7.3 | 64 | 8.4% | 25.4% | 3.0% | 64.6% | $244,400 |
| 9 | 78612 | Cedar Creek | 6.0 | 84 | 9.1% | 46.7% | 5.9% | 31.9% | $345,990 |
| 10 | 78704 | South Congress / Zilker | 5.2 | 44 | 9.9% | 40.6% | 4.8% | 51.1% | $783,000 |
Swipe table to see all columns
Spicewood is the deepest buyer's market in the metro
Nine months of supply, 83 cumulative days to sell, and closings landing 12.0 percent below original asking. Four in ten active listings have already been reduced, with a median reduction of 7.1 percent, and 22.2 percent of the inventory has been sitting more than 90 days.
Where the leverage actually sits
If you are buying in any of these ten, the leverage is real but it is not evenly distributed. It concentrates in listings that have already been cut once and have been sitting. A fresh listing in Spicewood still has an optimistic seller behind it. A listing 100 days in with one price reduction has a seller who has already accepted that the first number was wrong. That is who you negotiate with.
Suburbs are outperforming central Austin, and it is not close
This runs against the story most people tell about Austin, so here is the whole picture.
Months of Inventory by Region
Active listings September 8, 2026 against the June to August 2026 sales pace. Metro average 4.7 months.
| Region | Months supply | Cum. DOM | Off orig. price | Failure rate | $/sqft YoY | Median price |
|---|---|---|---|---|---|---|
| Southwest Austin | 3.3 | 32 | 5.1% | 27.5% | -1.4% | $610,000 |
| North Austin | 3.8 | 27 | 5.5% | 31.7% | -1.4% | $515,000 |
| Williamson County | 4.3 | 48 | 6.6% | 29.2% | -4.4% | $400,000 |
| South Corridor | 4.8 | 56 | 6.9% | 25.3% | -7.9% | $294,360 |
| West Austin / Lake Travis | 5.3 | 48 | 8.8% | 43.3% | 0.0% | $820,000 |
| East and Southeast Austin | 5.4 | 50 | 6.7% | 37.1% | -5.9% | $370,000 |
| Bastrop and East | 5.7 | 74 | 7.0% | 38.8% | -9.2% | $345,990 |
| Central Austin | 5.8 | 44 | 7.8% | 50.5% | -2.6% | $672,500 |
Swipe table to see all columns
Southwest and North Austin are holding value best, giving up only 1.4 percent per square foot while the outer corridors surrender eight and nine percent. They also sell fastest and fail least.
If you are one of the people we hear from constantly, the ones ready to trade the central Austin grind for a shorter drive to a bigger yard, the data supports the move on both ends. The neighborhoods you would be selling into have deep buyer pools and short marketing times. The trade is not what it was in 2021, when you would have been bidding against six other offers in Cedar Park. Today you have 227 active listings in Cedar Park to choose from and sellers who will negotiate.
Entry level homes are the softest part of the market
Most buyers assume the expensive end of a declining market falls hardest. In Austin right now, the opposite is true.
| Price tier | Months supply | Cum. DOM | Failure rate | New construction | $/sqft YoY |
|---|---|---|---|---|---|
| Under $350K | 5.1 | 56 | 33.0% | 49.8% | -7.2% |
| $350K to $500K | 4.7 | 47 | 32.5% | 29.2% | -3.7% |
| $500K to $750K | 4.6 | 42 | 37.4% | 20.0% | -1.8% |
| $750K to $1M | 3.7 | 34 | 37.2% | 12.3% | 0.0% |
| $1M and up | 3.7 | 37 | 40.8% | 5.2% | -5.6% |
Swipe table to see all columns
The last two columns explain each other. Half of everything selling under $350,000 in this metro is new construction, and builders are still cutting prices to move standing inventory. That competition sets the ceiling for every resale in the same price band.
If you own an entry level home
This is your single biggest headwind. You are not competing with the house down the street. You are competing with a builder who can drop $15,000, throw in closing costs, and buy down your buyer's rate, and who has a quarterly number to hit.
If you are a renter looking to buy your first home
The same fact is working for you. Entry level is where the negotiating room is, and builder incentives are frequently worth more than the sticker discount.
Where builder incentives are hiding the real discount
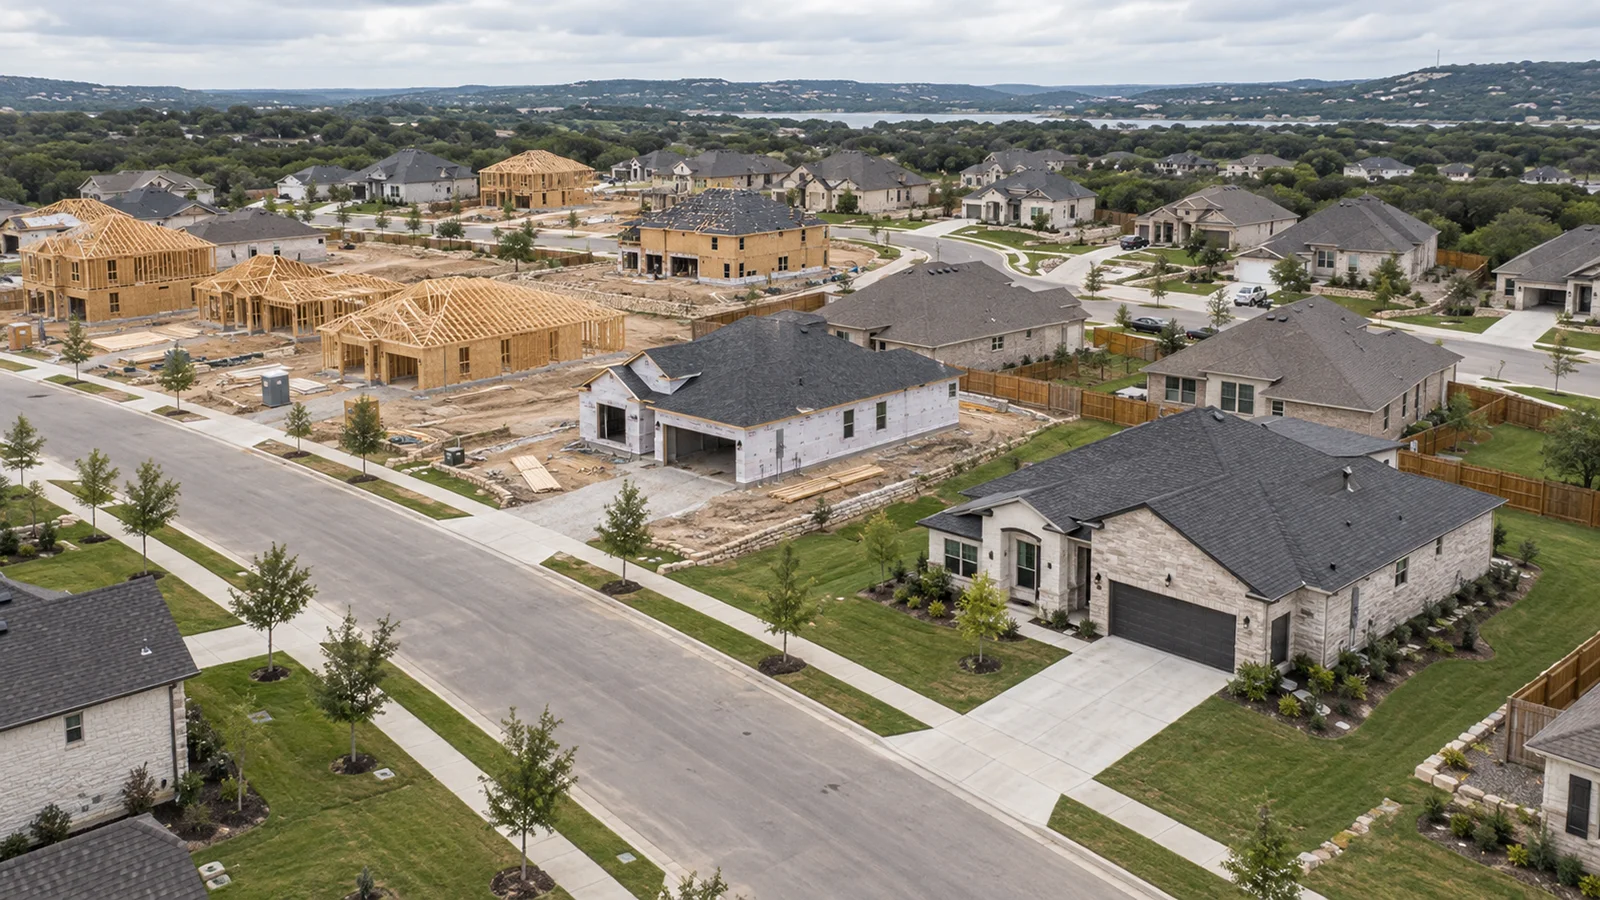
Compare two numbers and the builder markets become obvious. Sold to list price tells you how a home did against its most recent asking price. Sold to original list tells you how it did against the price it launched at. The gap is everything that got cut along the way.
| ZIP | Area | Sold to list | Sold to original | Gap | New construction |
|---|---|---|---|---|---|
| 78634 | Hutto | 98.0% | 92.5% | 5.4 pts | 58.7% |
| 78642 | Liberty Hill | 97.2% | 91.9% | 5.3 pts | 62.3% |
| 78640 | Kyle | 97.9% | 92.8% | 5.1 pts | 64.7% |
| 78628 | Georgetown West | 97.4% | 92.6% | 4.8 pts | 50.4% |
| 76537 | Jarrell | 97.4% | 92.6% | 4.8 pts | 62.9% |
Swipe table to see all columns
In Hutto, homes close at 98 percent of asking, which looks like a market with no negotiating room. But asking was already 5.4 percent below where the home launched. The discount is real, it just happened before you walked in the door.
Practical version
In these markets, do not spend your energy negotiating hard on a home that just listed. Find the one that has been standing 90 days with a reduction behind it. The builder's incentive budget is the same either way, and on an aged unit they are far more willing to spend it.
What actually changed this year
Strip out the noise and one thing happened in the Austin market over the last twelve months: supply tightened sharply while prices kept softening.
- Homes on the market fell 19.4 percent year over year
- New listings taken fell 7.3 percent
- Listings that failed to sell fell 19.1 percent
- Sellers held 1.67 points closer to their original asking price
- Homes sold 8.3 percent faster on a cumulative basis
- Yet price per square foot still fell 6.0 percent
Those two directions usually contradict each other. Here they do not, and the reason shows up in the new construction numbers. Builders' share of the market dropped from 33.6 percent to 31.3 percent over the year, and new listings have contracted for twelve straight months.
That is a market finding a floor, not a market recovering. It matters because a floor built on sellers staying home is fragile. If mortgage rates fall and the sellers who have been waiting all come back at once, the inventory relief we just saw reverses quickly.
For anyone weighing when to list: the competitive picture you are looking at today is the best it has been in two years, and it is not guaranteed to hold.
What this means for you
If you are selling
Your list price is the entire game right now. Across the metro, 42.9 percent of active listings have already taken a price cut, with a median reduction of 4.5 percent, and 11.9 percent have been sitting more than 90 days. Homes that price correctly on day one sell in about three weeks. Homes that start high spend three months getting to the same number and close for less. The 34.5 percent failure rate is almost entirely made up of listings that started too high and never caught up.
If you are buying
Pull cumulative days on market on everything before you write. Focus on listings that have been reduced and have aged. Ask which specific homes in a subdivision have builder incentives attached, because those are rarely advertised. And recognize that leverage in Austin is hyperlocal right now. You have real room in Spicewood and almost none in Circle C.
If you are relocating to Austin
The metro level story is far less useful to you than the neighborhood story. A 4.7 month average covers ZIP codes ranging from 1.6 to 9.3 months. Pick the neighborhood on schools, commute, and how you actually want to live, then use this data to understand what kind of negotiation you are walking into once you have picked.
If you are moving up or downsizing
You are on both sides of this market at once, and right now the two sides are not symmetrical. If you are selling in Southwest or Northwest Austin and buying in the Hill Country, on the lake, or in an outer suburb, that trade is currently in your favor by a meaningful margin. If you are going the other direction, selling in Spicewood or Marble Falls to buy in Cedar Park, be realistic about your sale timeline before you commit to a purchase.
Full rankings: all 66 ZIP codes
Ranked from strongest seller leverage to strongest buyer leverage.
Seller leverage, ranks 1 to 22
78739 Circle C, 78749 SW Austin, 78750 Anderson Mill, 78759 Northwest Hills, 78731 Far West, 78737 Belterra, 78613 Cedar Park, 78735 Barton Creek, 78727 Milwood, 78681 Round Rock, 78610 Buda, 78748 South Austin, 78728 Wells Branch, 78723 Windsor Park, 78633 Sun City, 78729 NW Austin, 78733 Bee Cave Road, 78744 Southeast Austin, 78738 Bee Cave, 78665 Round Rock, 78757 Crestview, 78717 Avery Ranch.
Balanced, ranks 23 to 44
78726 Four Points, 78732 Steiner Ranch, 78652 Manchaca, 78617 Del Valle, 78660 Pflugerville, 78620 Dripping Springs, 78754 North Austin, 78751 Hyde Park, 78725 Hornsby Bend, 78640 Kyle, 78634 Hutto, 78664 Round Rock, 78745 South Austin, 78621 Elgin, 78628 Georgetown West, 78619 Driftwood, 76537 Jarrell, 78753 North Austin, 78730 River Place, 78746 West Lake Hills, 76574 Taylor, 78724 East Austin.
Buyer leverage, ranks 45 to 66
78626 Georgetown, 78644 Lockhart, 78641 Leander, 78747 Southeast Austin, 78642 Liberty Hill, 78758 North Austin, 78734 Lakeway, 78736 Oak Hill, 78602 Bastrop, 78653 Manor, 78666 San Marcos, 78703 Tarrytown, 78704 South Congress, 78612 Cedar Creek, 78705 West Campus, 78702 East Austin, 78741 East Riverside, 78721 East Austin, 78645 Lago Vista, 78654 Marble Falls, 78701 Downtown, 78669 Spicewood.
Methodology
Most market reports rank neighborhoods on months of inventory alone. Months of inventory is a useful number, but on its own it is misleading, because a ZIP code can show low inventory simply because nothing is listed there, not because anything is selling.
We score six measures instead.
| Measure | Weight | What it captures |
|---|---|---|
| Months of inventory | 30% | Supply against the current sales pace |
| Sold to original list price | 20% | How much sellers actually concede |
| Cumulative days on market | 15% | True marketing time, relisting included |
| Share of pipeline under contract | 15% | Whether listings are converting |
| Share of active listings reduced | 10% | Pricing pressure on standing inventory |
| Listing failure rate | 10% | How often listings never sell at all |
Swipe table to see all columns
Each measure is standardized across the 66 ranked ZIP codes and weighted. Months of inventory and cumulative days on market are log transformed so that extreme values do not dominate. A higher score means more seller leverage.
Months of inventory uses active listings as of September 8, 2026 against the June through August 2026 sales pace. Failure rate and new construction share use trailing twelve month figures, September 2025 through August 2026. Price per square foot comparisons use June through August 2026 against the same period in 2025. All ratios are computed from aggregate dollar sums rather than averages of individual ratios, so that a single unusual sale cannot distort a ZIP code's results.
Six ZIP codes were excluded from ranking for having fewer than 25 closings in the June through August window: 78615, 78719, 78722, 78742, 78752, and 78756.
Source: Unlock MLS, residential sales only. Sold data August 2024 through August 2026. Active inventory pulled September 8, 2026. Analysis by Shipman Partners.
Information is deemed reliable but not guaranteed. Market statistics are not a substitute for a comparative market analysis of a specific property.
About this report
Shipman Partners is a family owned brokerage in Northwest Austin. Allen Shipman has been licensed since 2007 and a broker since 2010, and has worked the Northwest Austin market since 1998. We run our own MLS analysis rather than reprinting association summaries, which is why this report contains numbers you will not find elsewhere.
We publish this report monthly. The September 2026 edition comes out in early October.
What is your ZIP code actually doing?
The metro numbers in this report are a starting point, not an answer. We will pull the comparable sales for your actual home, on your actual street.
Request Your Home Analysis512-222-6958 | shipmanpartners.com