Austin Real Estate’s "Shadow Recovery": Why Spring 2026 is the Smartest Time to Buy in 2 Years
Uncovering the "Hidden Discounts", High-Velocity "Islands of Heat," and the Luxury Migration across North and Northwest Austin.

allen@shipmanpartners.com
Published March 5th, 2026
I. The Big Picture: Austin’s Spring Market Has Arrived Early
The February 2026 data from Unlock MLS tells a clear story: Austin has found its floor. While national news remains fixated on stagnant rates, the Austin MSA saw a 34.3% surge in transaction volume month-over-month. This is the “Shadow Recovery”—a market where volume is roaring back while prices remain stabilized, offering a unique window for strategic moves.
The Interest Rate Tailwind: The 30-year fixed mortgage rate has glided down from 6.85% (Feb 2025) to 6.05% (Feb 2026). This nearly 1% drop is the fuel behind the massive increase in sales we are witnessing today.
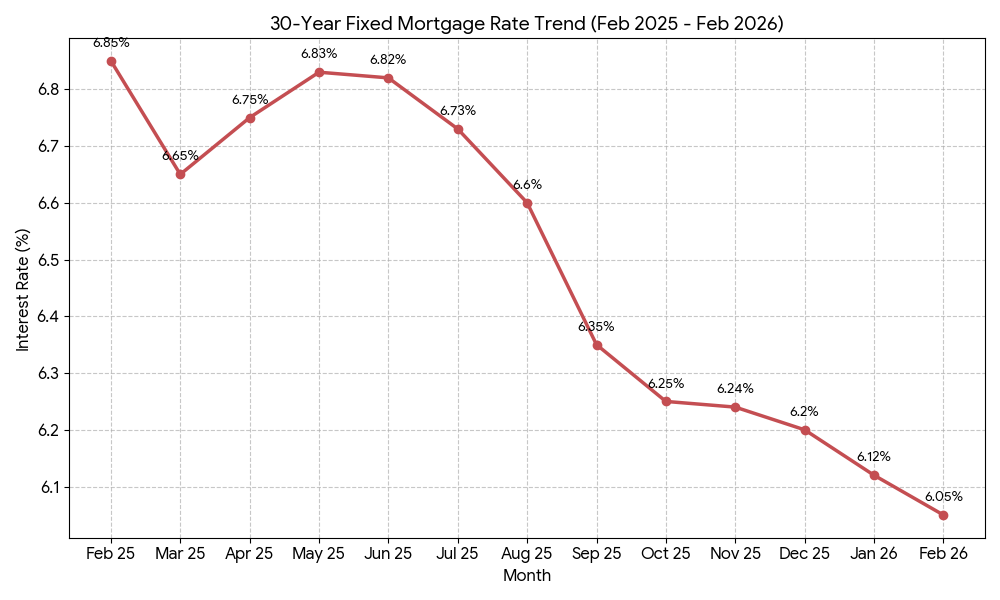
This 0.8% drop in rates since Feb 2025 represents more than just a lower number; for a median-priced home in Austin, it translates to roughly $300-$400 in monthly savings. This ‘affordability unlock’ is exactly why we are seeing buyers who were hesitant in 2025 suddenly flood back into the market in early 2026.
II. The Broader Austin Market: Top 10 Performance Lists
The broader MSA is showing intense fragmentation. Some zips are in full-blown bidding wars, while others offer incredible negotiation leverage.
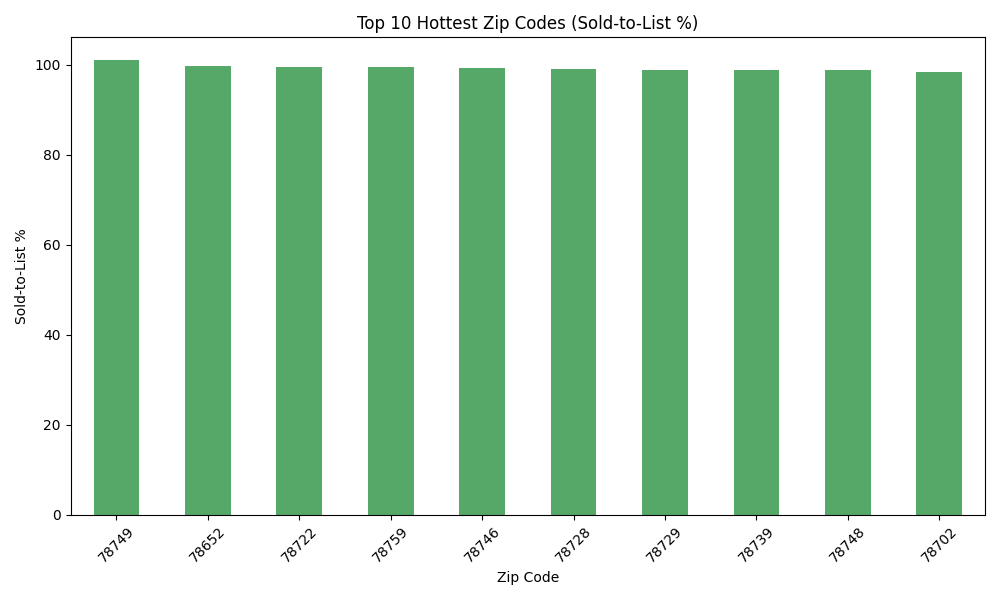
Top 10 Hottest Zip Codes (Sold-to-List Ratio)
The “Seller” zones where homes sell for 100%+ of asking.
- 78749 (South Austin) – 101.0%
- 78652 (Manchaca) – 99.6%
- 78722 (French Place) – 99.4%
- 78759 (Arboretum) – 99.4%
- 78746 (West Lake Hills) – 99.2%
- 78728 (Wells Branch) – 99.0%
- 78729 (Jollyville) – 98.9%
- 78739 (Circle C) – 98.7%
- 78748 (Shady Hollow) – 98.7%
- 78702 (East Austin) – 98.4%
See Available Homes in the Hot and Fast Moving 78729 Zip Code
No Results Found.
Top 10 Fastest Moving Markets (Median Days on Market)
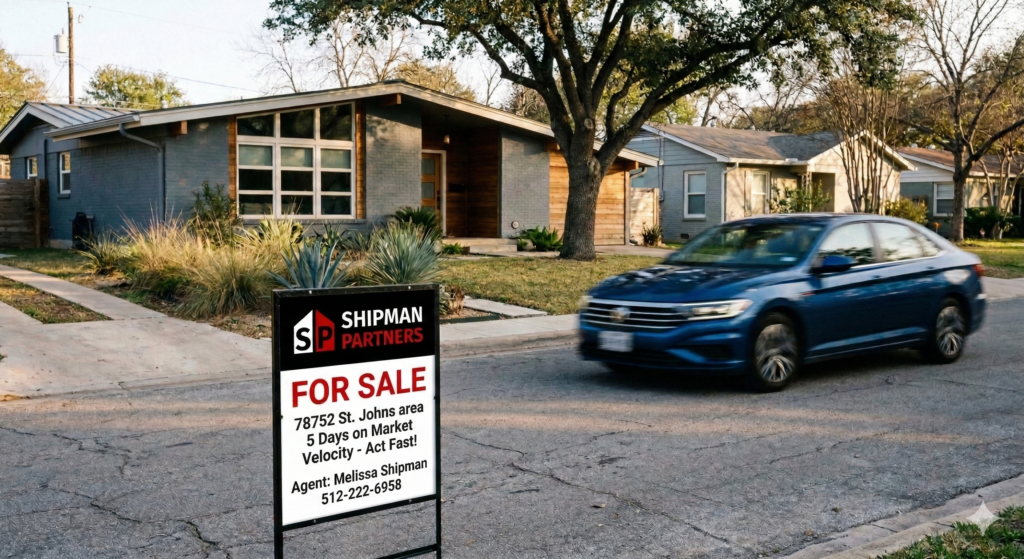
- 78752 (Highland) – 6 Days
- 78703 (Tarrytown) – 10 Days
- 78729 (Jollyville) – 14 Days
- 78725 (Hornsby Bend) – 17 Days
- 78730 (River Place) – 19 Days
- 78759 (Arboretum) – 24 Days
- 78736 (Oak Hill) – 26 Days
- 78751 (Hyde Park) – 33 Days
- 78733 (Rob Roy) – 33 Days
- 78728 (Wells Branch) – 35 Days
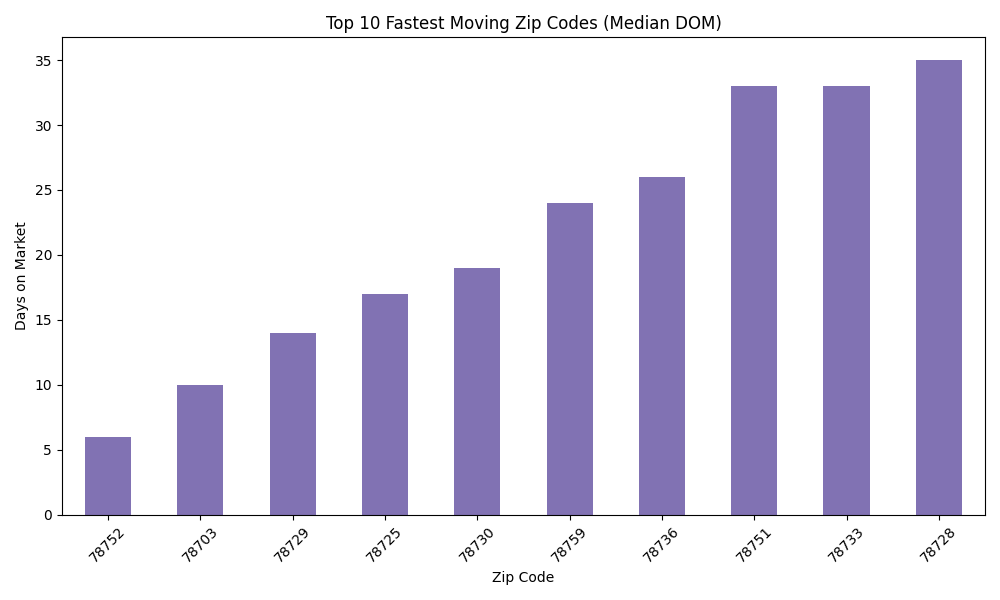
As we transition into the peak spring and summer selling seasons, buyers looking in these high-velocity zip codes must be prepared to act with surgical precision. When the median ‘Days on Market’ drops into the single digits, there is no room for hesitation; these are effectively ‘Islands of Heat’ where the environment still strongly favors the seller. At Shipman Partners, we specialize in guiding our clients through these competitive pockets. We help you prepare ‘winning-ready’ offers, balancing speed with strategic terms, to ensure that when you find the right home in a fast-moving market, you have the competitive edge needed to beat out multiple offers and secure the contract.
Schedule a Buyers Consultation:
Available Homes in the Hot 78752 Zip Code
No Results Found.
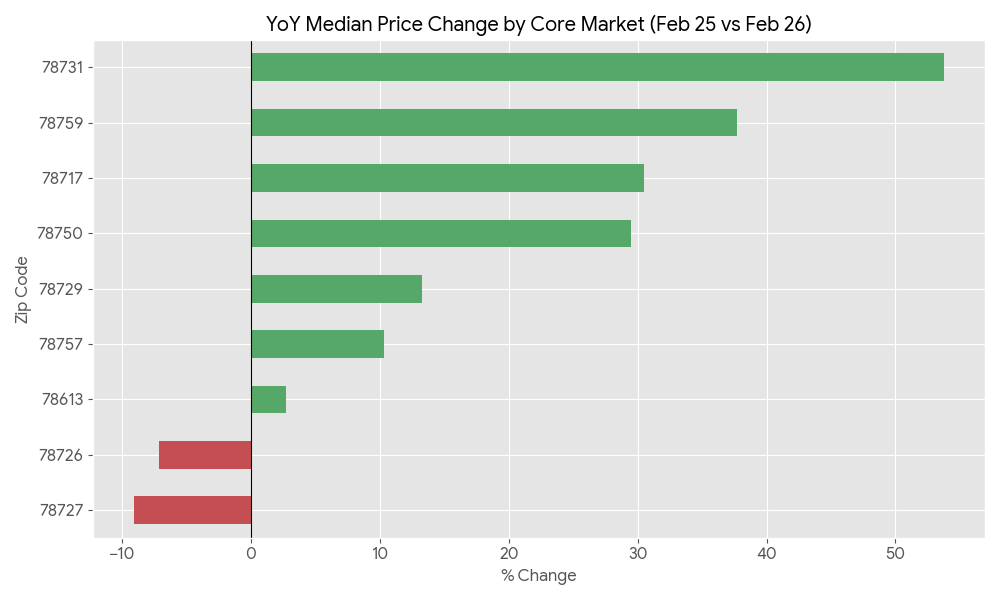
III. Deep Dive: North & Northwest Austin (The Shipman Partners Core 9)
This is where we focus most of our attention, and the data explains why. These North and NW Austin pockets are outperforming the MSA in price resilience and velocity.
| Zip Code | Neighborhood/Area | Market Status | Median Price | YoY Change | Sold-to-List % | Concession Rate | Median DOM |
|---|---|---|---|---|---|---|---|
| 78759 | Arboretum/Great Hills | Bidding War Zone | $730,000 | 38% | 99.40% | 36.40% | 24 |
| 78729 | Jollyville/NW Austin | High Velocity | $430,000 | 13% | 98.90% | 50.00% | 14 |
| 78731 | Northwest Hills | Luxury Resilience | $1,000,000 | 54% | 94.70% | 42.90% | 83 |
| 78750 | Spicewood/Anderson Mill | Buyer's Advantage | $680,000 | 30% | 97.60% | 59.30% | 69 |
| 78757 | Crestview/Burnet Rd | Resilient Growth | $750,000 | 10% | 97.00% | 37.90% | 53 |
| 78717 | Avery Ranch/Brushy Creek | Resilient Growth | $620,000 | 31% | 96.60% | 37.50% | 59 |
| 78613 | Cedar Park | Stable Recovery | $457,000 | 3% | 96.50% | 44.40% | 41 |
| 78727 | Walnut Creek/Milwood | Stable Recovery | $450,000 | -9% | 97.20% | 46.20% | 56 |
| 78726 | Canyon Creek/620 | Buyer's Advantage | $650,000 | -7% | 96.10% | 57.10% | 77 |
The "Marketing Stunt" Angle:
In 78759, the sold-to-list ratio is 99.4%. We are seeing a return to the strategy of pricing homes just under market value to ignite interest. If you’re a seller in North Austin, this is your play. If you’re a buyer, expect competition.
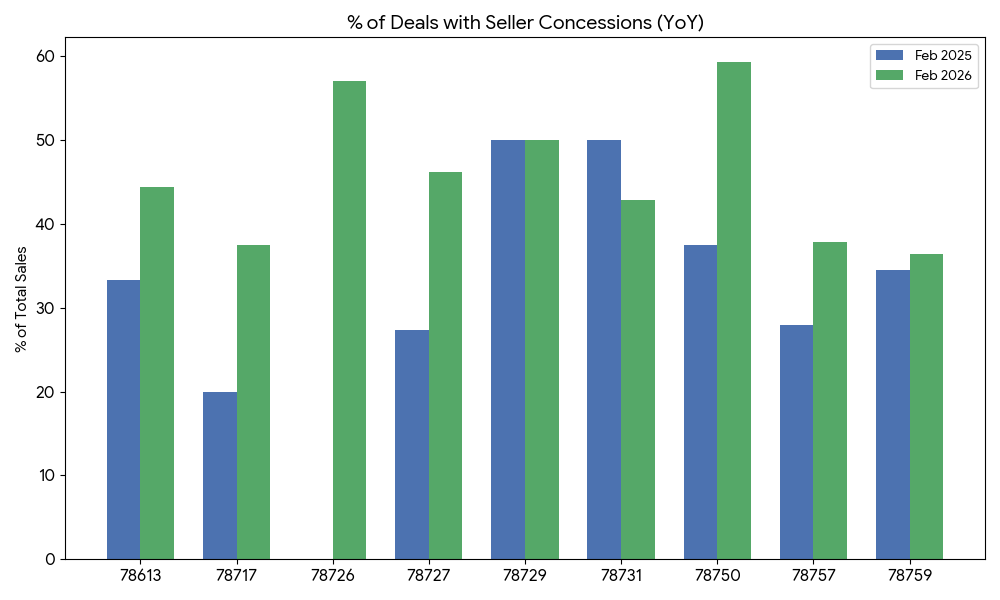
IV. The "Hidden Discount": Why the Sticker Price is a Lie
You cannot judge the Austin market by the list price alone. We are seeing a massive trend in Seller Concessions.
The Stat: In 78750, 59.3% of all sales included seller-paid concessions. Research 78750.
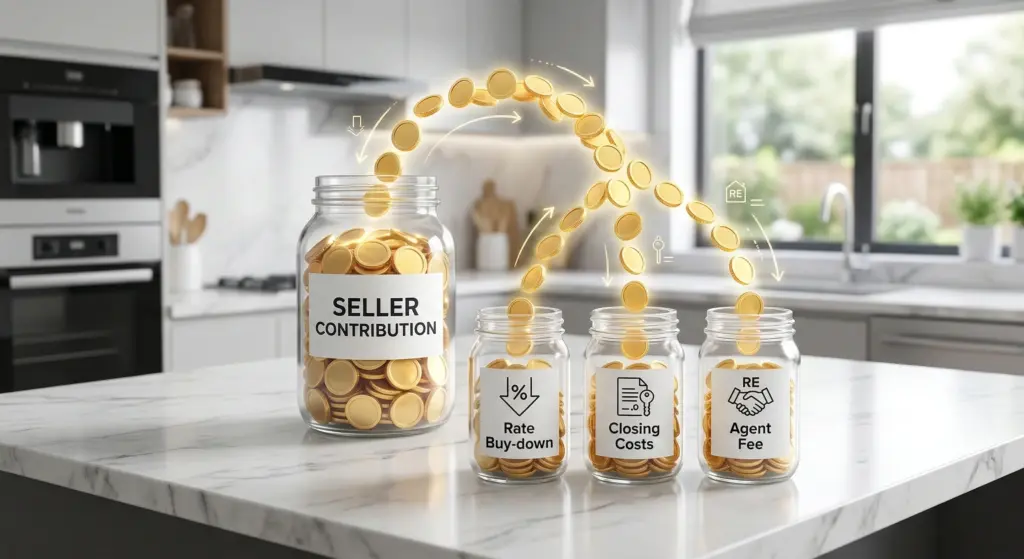
The Reality: Sellers are currently yielding 2-3% off list price to get deals done, but they are often doing it through “Shadow Subsidies”—paying for your 2-1 interest rate buy-down, closing costs, and buyers agent commissions rather than dropping the price. This keeps neighborhood comps high while making the home significantly more affordable for you.
At Shipman Partners, we don’t just find homes; we engineer deals. Our agents specialize in negotiating the maximum possible seller contribution for our buyers, turning the ‘Sticker Price’ into a flexible financial tool. Once we’ve secured those funds, we work with you to prioritize exactly where those dollars go—whether your goal is to minimize your out-of-pocket cash at closing, or to maximize your long-term monthly savings through a strategic interest rate buy-down. We ensure every dollar of that seller contribution is deployed to create the greatest immediate and long-term benefit for your specific financial situation.
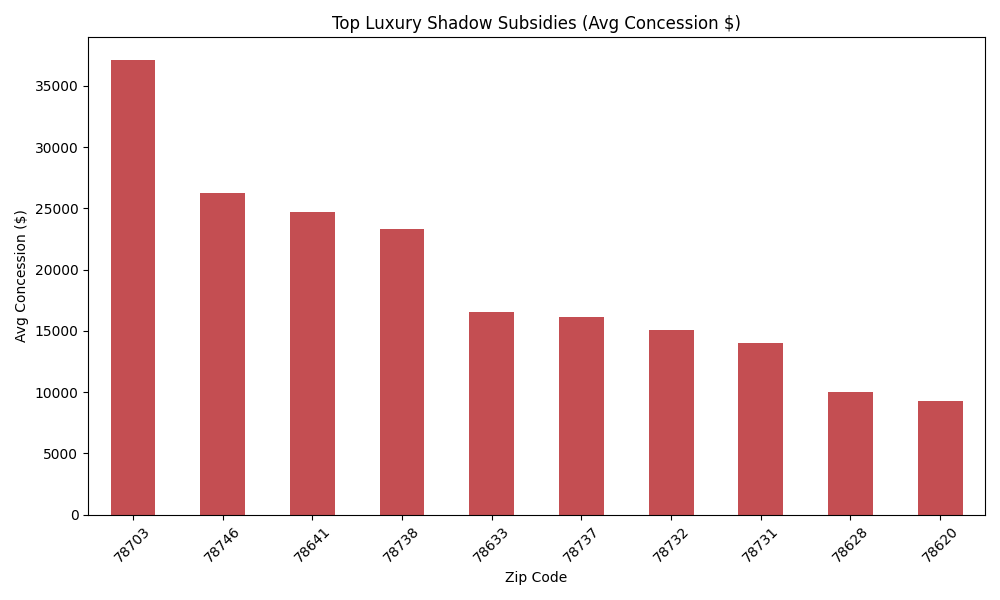
V. Luxury Market Deep Dive ($1M+)
The luxury market is expanding its borders. We are seeing a “Luxury Migration” into areas that were traditionally considered “suburban starter” zips.
New Luxury Pockets: 76537, 78660 (Pflugerville), and 78745 all saw $1M+ sales this month that didn’t exist in early 2025.
Luxury Concessions: Even at the high end, buyers are negotiating. In 78703 (Tarrytown), the average concession for a luxury home is over $$37,000.
The fact that we are seeing $1M+ sales in Pflugerville (78660) and Southeast Austin (78745) is a historic shift. It signals that the ‘Luxury’ label is no longer confined to Westlake or Tarrytown. High-end buyers are prioritizing square footage and newer builds in the suburbs, effectively ‘upscaling’ neighborhoods that were considered entry-level just five years ago.
Currently Available Million-Dollar Homes in Austin's Top 5 Luxury Markets
No Results Found.
Final Thoughts: Navigating the 2026 Austin "Shadow Recovery"
The February 2026 data confirms that the Austin market is no longer in a state of “waiting”—it is in a state of strategic action. While the broader headlines may focus on high-level median price shifts, the true story is found in the “Shadow Recovery.”
Through the aggressive use of Seller Contribution Buckets, buyers are effectively turning back the clock on interest rates, while sellers in high-velocity “Islands of Heat” like 78759 and 78729 are still commanding top-of-market attention.
The Shipman Partners Bottom Line:
The Window is Open: With mortgage rates on a 13-month decline (now at 6.05%), purchasing power has increased significantly.
The Sticker Price is Just a Starting Point: Between the NAR settlement changes and the rise of the 2-1 buy-down, the way we negotiate a “deal” has changed. We aren’t just looking for price drops; we are looking for maximum credit buckets.
Hyper-Local Matters: Whether you are looking for the “Executive Resilience” of 78731 or the “Buyer’s Advantage” in 78750, your strategy must be tailored to the specific zip code.
Austin isn’t just one market; it’s dozens of micro-markets moving at different speeds. At Shipman Partners, we provide the data, the negotiation tactics, and the hyper-local expertise to ensure you don’t just find a house, you win a strategic asset.
Schedule a Listing Consultation:
FAQ
What is the most resilient real estate market in Austin right now?
As of Feb 2026, 78733 and 78731 are the most resilient, showing year-over-year median price growth of 66.7% and 53.8% respectively.
Is it a good time to buy a home in Austin in 2026?
Yes. With mortgage rates down to 6.05% and over 40% of sellers offering closing cost concessions, buyers currently have more negotiation power than at any point in the last two years.
Has the Austin real estate market officially reached its floor in 2026?
While the market is hyper-local, the February 2026 data indicates the floor is likely in. With a 34.3% surge in transaction volume and a 1.7% month-over-month increase in median price, we are seeing “buyer exhaustion” turn into “buyer action.” When volume returns before prices spike, it typically signals the end of the corrective phase and the beginning of a recovery.
About Shipman Partners
Shipman Partners is a boutique family-owned real estate brokerage serving the Austin metro area since 2010. We bring an analytical, client-focused approach to luxury real estate, combining decades of experience with hands-on market knowledge. Whether buying or selling, we’re committed to providing personalized service and data-driven guidance.
Contact us today to discuss your luxury real estate needs in Austin.
Data Source & Methodology
The data presented in this analysis comes from sold listings reported through Unlock MLS, the multiple listing service operated by the Austin Board of Realtors. This comprehensive dataset covers 72 zip codes representing the majority of the Austin Metropolitan Statistical Area (MSA) and includes all luxury home sales that closed during the 2025 calendar year. It’s important to note that this analysis reflects MLS-reported transactions only. Private sales that occurred off-market and were not reported through Unlock MLS are not included in these figures. While care has been taken to ensure data accuracy, minor discrepancies may exist due to system reporting variations or human error in the original listings. For buyers and sellers, this means the actual number of million-dollar transactions may be slightly higher when accounting for off-market deals. However, MLS data provides the most comprehensive and reliable view of Austin’s luxury real estate market, representing the vast majority of transactions at this price point.